I have to create a risk matrix and I want to use the Treemap visual. In the details of the visual I placed the fields with the Risk Classes: Low, Medium, High and Very high.
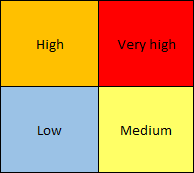
The problem is that the visual puts the different classes in an order that not suits my needs. What I want is the following order of classes in the Treemap visual:
Unfortunately I can’t tweak the order… So for example Very High is placed beneath and that doesn’t make sense. Can someone please help me out? If there is a better visual for risk cases, it’s all right too.
Use of a treemap is a clever kludge here, but given the varying sizes of the boxes I don’t think you’ll ever be able to dictate a predictable, consistent order of the boxes.
xViz is coming out with a risk matrix custom visual that looks like it may be exactly what you need, but it’s not going to be available until later this quarter.
In the interim, here’s something to take a look at:
As @BrianJ mentioned, it will not be possible to try treemap in above mentioned case. Treemap will always default to sort by the value, highest to lowest. I would suggest to use some other chart if you need sorting by Category.