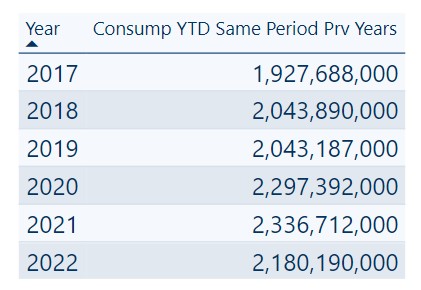
I’m trying to calculate the average of the last three years of consumption for the same period of previous years. For example, the current Max Month is August 2022 so I’ve calculated the following:
DAX:
Consump YTD Same Period Three Year Avg =
VAR MaxMonth = [Max Month]
RETURN
    CALCULATE ( [ConsumptionYTD (kgal)], Dates[MonthOfYear] <= [Max Month] )
Each year’s total is through August. Good stuff. But I can’t figure out how to filter the last three years using DAX, sum them up, and divide by a dynamic three-year interval.
Is this the right approach to the problem? I’ve tried using DATESINPERIOD rolling average approach but the result is an average for every billing date in the fact table.
This will be an intermediate calculation used in other measures.
Hi @RandyS, we aim to consistently improve the topics being posted on the forum to help you in getting a strong solution faster. While waiting for a response, here are some tips so you can get the most out of the forum and other Enterprise DNA resources.
Use the forum search to discover if your query has been asked before by another member.
When posting a topic with formula make sure that it is correctly formatted to preformatted text </>.
Use the proper category that best describes your topic
Provide as much context to a question as possible.
Include the masked demo pbix file, images of the entire scenario you are dealing with, screenshot of the data model, details of how you want to visualize a result, and any other supporting links and details.
Consumption last three years =
CALCULATE (
    SUM ( ConsumptionData[Consumption (kgal)] ),
    DATESINPERIOD ( 'Dates'[Date], MAX ( 'Dates'[Date] ), -3, YEAR )
)
Results in:
2020 Total Consumption
2021 Total Consumption
2022 YTD Consumption (Through Max Date August 31st 2022)
I can’t figure out how to combine the filtering used in Post #1 with this Measure to filter Years 2020 and 2021 for the same period as 2022 and get a total. The resulting value should be 6,814,294.