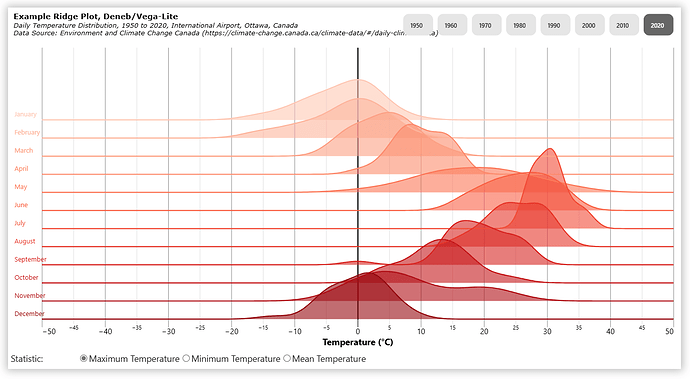
I like the ridge plot @Greg shared in Deneb Example - Ridge Plot.
The separate set of layers for each month resulted in extensive, repetitive code and that had me convinced we could optimize with some transforms. I was worried about scalability and maintenance.
I made an attempt at keeping all of Greg’s settings intact.
Instead of separate layers for each month, I use a single area layer, a single baseline rule layer, and a single label layer. I used transformations to group and process the temperature data by month, allowing the plotting of all months within the same layers. and I used calculations to position the ridgelines.
These change resulting in 1300 lines vs. 259 lines. the color scheme I chose doesn’t really work because the earlier month labels are near transparent. That’s an easy thing to fix.
  "$schema": "https://vega.github.io/schema/vega-lite/v5.json",
  "title": {
    "anchor": "start",
    "align": "left",
    "offset": 20,
    "text": "Example Ridge Plot, Deneb/Vega-Lite",
    "font": "Verdana",
    "fontSize": 14,
    "fontWeight": "bold",
    "fontStyle": "normal",
    "subtitle": [
      "Daily Temperature Distribution, 1950 to 2020, International Airport, Ottawa, Canada",
      "Data Source: Environment and Climate Change Canada (https://climate-change.canada.ca/climate-data/#/daily-climate-data)"
    ],
    "subtitleFont": "Verdana",
    "subtitleFontSize": 12,
    "subtitleFontWeight": "normal",
    "subtitleFontStyle": "italic"
  },
  "data": {
    "name": "dataset"
  },
  "width": 1140,
  "height": 490,
  "transform": [
    {
      "calculate": "_temperature_statistic == 'Maximum Temperature' ? datum['MAX_TEMPERATURE'] : _temperature_statistic == 'Minimum Temperature' ? datum['MIN_TEMPERATURE'] : datum['MEAN_TEMPERATURE']",
      "as": "_temperature"
    },
    {
      "calculate": "month(datum['Date'])",
      "as": "_month"
    },
    {
      "calculate": "timeFormat(datum['Date'], '%B')",
      "as": "_month_name"
    },
    {
      "calculate": "11 - datum['_month']",
      "as": "_reverse_month"
    },
    {
      "calculate": "datum['_reverse_month'] * _month_y_increment",
      "as": "_month_y_offset"
    }
  ],
  "params": [
    {
      "name": "_temperature_statistic",
      "value": "Maximum Temperature",
      "bind": {
        "input": "radio",
        "options": [
          "Maximum Temperature",
          "Minimum Temperature",
          "Mean Temperature"
        ],
        "name": "Statistic: "
      }
    },
    {
      "name": "_month_y_increment",
      "value": 0.03
    }
  ],
  "layer": [
    {
      "transform": [
        {
          "density": "_temperature",
          "groupby": [
            "_month",
            "_month_name",
            "_month_y_offset"
          ],
          "extent": [
            -50,
            50
          ],
          "as": [
            "_kde_value",
            "_kde_density"
          ]
        },
        {
          "calculate": "datum['_kde_density'] + datum['_month_y_offset']",
          "as": "_new_kde_density"
        }
      ],
      "mark": {
        "type": "area",
        "opacity": 0.6,
        "interpolate": "monotone"
      },
      "encoding": {
        "x": {
          "field": "_kde_value",
          "type": "quantitative",
          "title": "Temperature (°C)",
          "axis": {
            "domain": false,
            "labelFontSize": {
              "expr": "datum.value % 10 == 0 ? 14 : 10"
            },
            "labelFont": "Segoe UI",
            "titleFontSize": 16,
            "titleFont": "Segoe UI",
            "gridColor": {
              "expr": "datum.value == 0 ? 'black' : datum.value % 10 == 0 ? '#969696' : '#E3E3E3'"
            },
            "gridWidth": {
              "expr": "datum.value == 0 ? 2 : 1"
            },
            "tickSize": {
              "expr": "datum.value % 10 == 0 ? 14 : 8"
            },
            "tickColor": {
              "expr": "datum.value == 0 ? 'black' : datum.value % 10 == 0 ? '#969696' : '#E3E3E3'"
            },
            "orient": "bottom"
          },
          "scale": {
            "domain": [
              -50,
              50
            ]
          }
        },
        "y": {
          "field": "_new_kde_density",
          "type": "quantitative",
          "axis": null,
          "scale": {
            "domain": [
              0,
              0.45
            ]
          }
        },
        "y2": {
          "field": "_month_y_offset"
        },
        "color": {
          "field": "_month",
          "type": "quantitative",
          "legend": null,
          "scale": {
            "scheme": "reds",
            "domain": [
              0,
              11
            ]
          }
        },
        "tooltip": [
          {
            "field": "_month_name",
            "type": "nominal",
            "title": "Month"
          },
          {
            "field": "_kde_value",
            "type": "quantitative",
            "title": "Temperature"
          },
          {
            "field": "_kde_density",
            "type": "quantitative",
            "title": "Density"
          }
        ]
      }
    },
    {
      "transform": [
        {
          "aggregate": [
            {
              "op": "min",
              "field": "_kde_value",
              "as": "_kde_value_min"
            }
          ],
          "groupby": [
            "_month",
            "_month_name",
            "_month_y_offset"
          ]
        }
      ],
      "mark": {
        "type": "rule",
        "color": "transparant"
      },
      "encoding": {
        "x": {
          "value": -50
        },
        "x2": {
          "value": 50
        },
        "y": {
          "field": "_month_y_offset",
          "type": "quantitative"
        }
      }
    },
    {
      "transform": [
        {
          "aggregate": [
            {
              "op": "min",
              "field": "_kde_value",
              "as": "_kde_value_min"
            }
          ],
          "groupby": [
            "_month",
            "_month_name",
            "_month_y_offset"
          ]
        }
      ],
      "mark": {
        "type": "text",
        "yOffset": -10,
        "fontSize": 12,
        "font": "Segoe UI"
      },
      "encoding": {
        "text": {
          "field": "_month_name",
          "type": "nominal"
        },
        "x": {
          "value": -49.5
        },
        "y": {
          "field": "_month_y_offset",
          "type": "quantitative"
        },
        "color": {
          "field": "_month",
          "type": "quantitative",
          "scale": {
            "scheme": "reds",
            "domain": [
              0,
              11
            ]
          },
          "legend": null
        }
      }
    }
  ]
}
