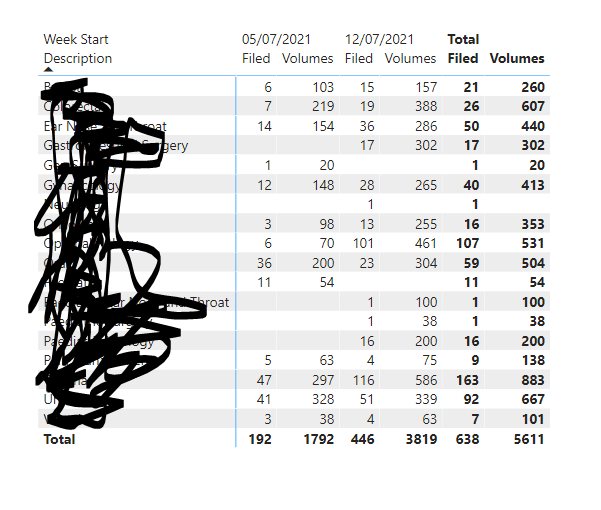
I am trying to use MIN and MAX in a measure for labeling when you do a drill through from one page to the other. This is to be used with a text field as a title for a drill-through report. Images below
Expectation:
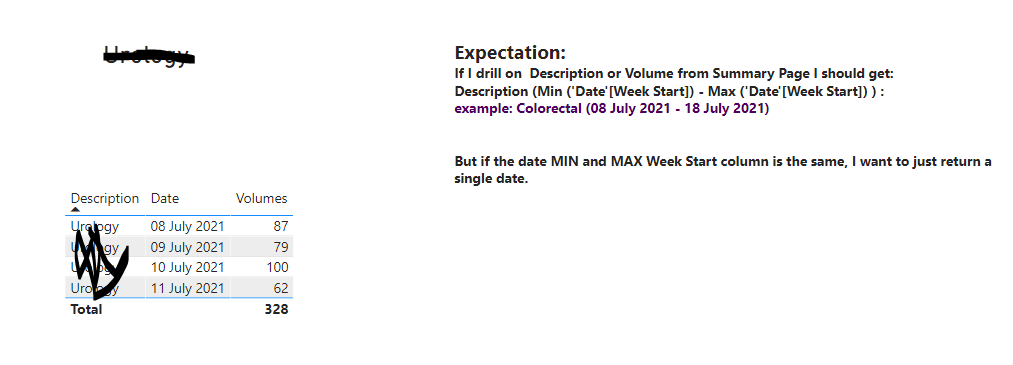
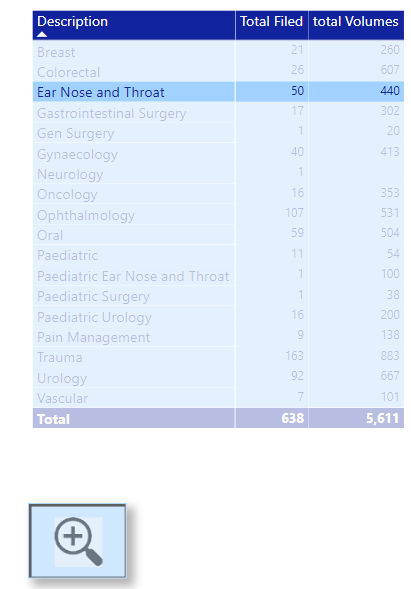
If I drill on Description or Volume from Summary Page I should get:
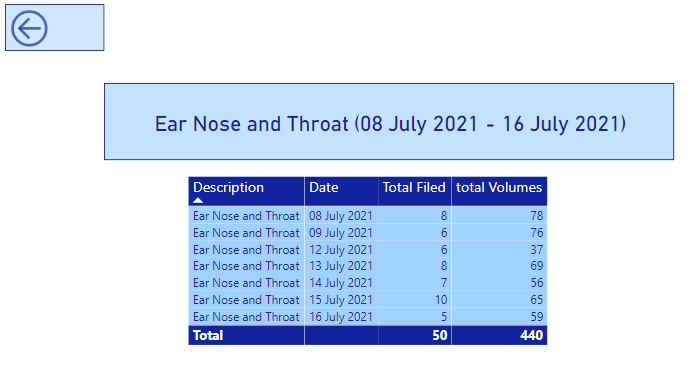
Description (Min (‘Date’[Week Start]) - Max** (‘Date’[Week Start]) **) :
example: Colorectal (08 July 2021 - 18 July 2021)
But if the date MIN and MAX Week Start column is the same, I want to just return a single date.
Format Date Measures.pbix (88.0 KB)
How do I get this to work, please?
I do anticipate your help
Thank you
Hi @upwardD! We noticed that your inquiry was left unsolved for quite some time now. We strive to answer ALL inquiries in the forum. However, if you are sure that you provided all pertinent context to your concerns and read how to use the forum more effectively and still find your question unanswered, you can check out tutorials to learn this yourself as your membership also comes with relevant resources that may help you with your Power BI education.
While our users and experts do as much as reasonable to help you with your inquiries, not all concerns can be attended to especially if there are some learnings to be done. Thank you!
Hi @upwardD , (version 3)
A bit late, but please receive hereby a solution for your request.
Solution summary:
- determine the requested description including the first and last date with the use of a measure to transfer this description into the requested Detail report header.
- used the standard Power BI drill-through functionality, with two buttons added to ease user navigation
See attached PBIX :
Format Date Measures v11 measure.pbix (74.2 KB)
Technical workout of this solution:
Ad 1. Measure for requested description
-
To dynamically select the requested Description header, a measure is developed which filters
the first and last date, given the selected Description; the requested description header is made by formatting the dates found and concatenate the dates together with the description.
Requested Detail-Header =
 var Description1 = SELECTEDVALUE('Fact'[Description] )
 var FirstStart3 = CALCULATE( MIN('Fact'[Date]), FILTER( 'Fact', 'Fact'[Description] = Description1))
 var LastStart3 = CALCULATE( MAX('Fact'[Date]), FILTER( 'Fact', 'Fact'[Description] = Description1))
 var RequestedDescription = Description1 & " (" & FORMAT(FirstStart3,"DD MMMM YYYY") & IF(FirstStart3 = LastStart3 , ")", " - " & FORMAT(LastStart3,"DD MMMM YYYY") & ")")
return RequestedDescription
P.S. The Drill Through, including filtering on “Description”, has to be set up to let the measure pick up a “Description” at SELECTEDVALUE((‘Fact’[Description])
Ad 2 Drill Through set up
See also the link below with the Enterprise DNA Explanation how to use Drill Through in Power BI
-
Turn on the Drill Through, add also “Description” in the Drill Through report
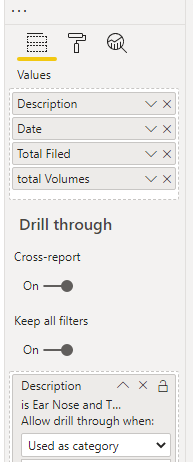
-
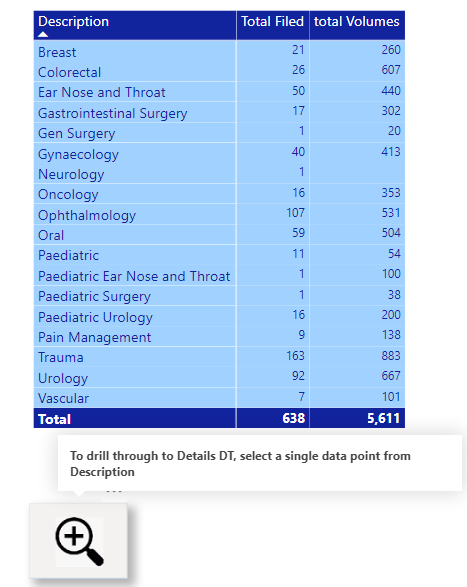
Select on a item in the “Drill from” report the Drill Through report page (Detail DT)
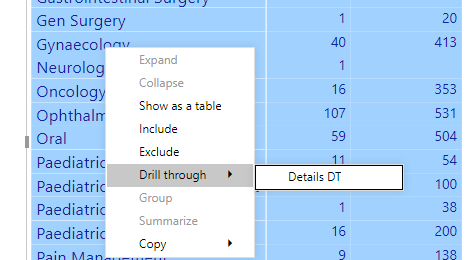
-
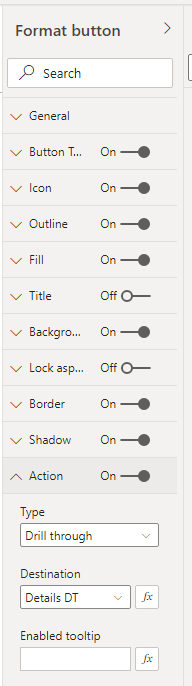
Add navigation icons and configure by selecting the icon, and go to Format button, whereby “Action” is the most important
Two reports are made:
- Overview report with navigation button to ease the drill-through to the Detail-page
1a. Overview report selected:
- Detailed report of selection
Enterprise DNA Explanation how to use Drill Through in Power BI
4 Likes