Hello @SammiP,
Thank You for posting your query onto the Forum.
Firstly, I would like to highlight the fact that the starting point of your formula itself was incorrect. You built the formula using the “Measure Branching Technique” without going through or knowing the behaviour of the primary formulas and that’s where it started to throw the wrong results.
Now, as you pointed out the fact that the last data point into the table is as on “30th December, 2019” (Sales Table) and Date table goes upto the year 2020.
So now, since we know that last data point is as on “30th December, 2019” so while referencing the context into the function “LASTDATE()” it should have been as “LASTDATE( Sales[Purchase Date] )” rather than referring the date column of the date table i.e. “LASTDATE( Dates[Date] )”. It doesn’t matter upto what period you’ve date table in your model what we’re concerned is with the “last data point” that we’ve in the Sales table.
So Sam Sir’s formula is like this in the file which you’ve provided -
Total Revenue - Sam =
CALCULATE( [Revenue],
	FILTER( Dates,
		Dates[Date] <= TODAY() &&
        Dates[Date] >= TODAY() - [Total Days] ) )
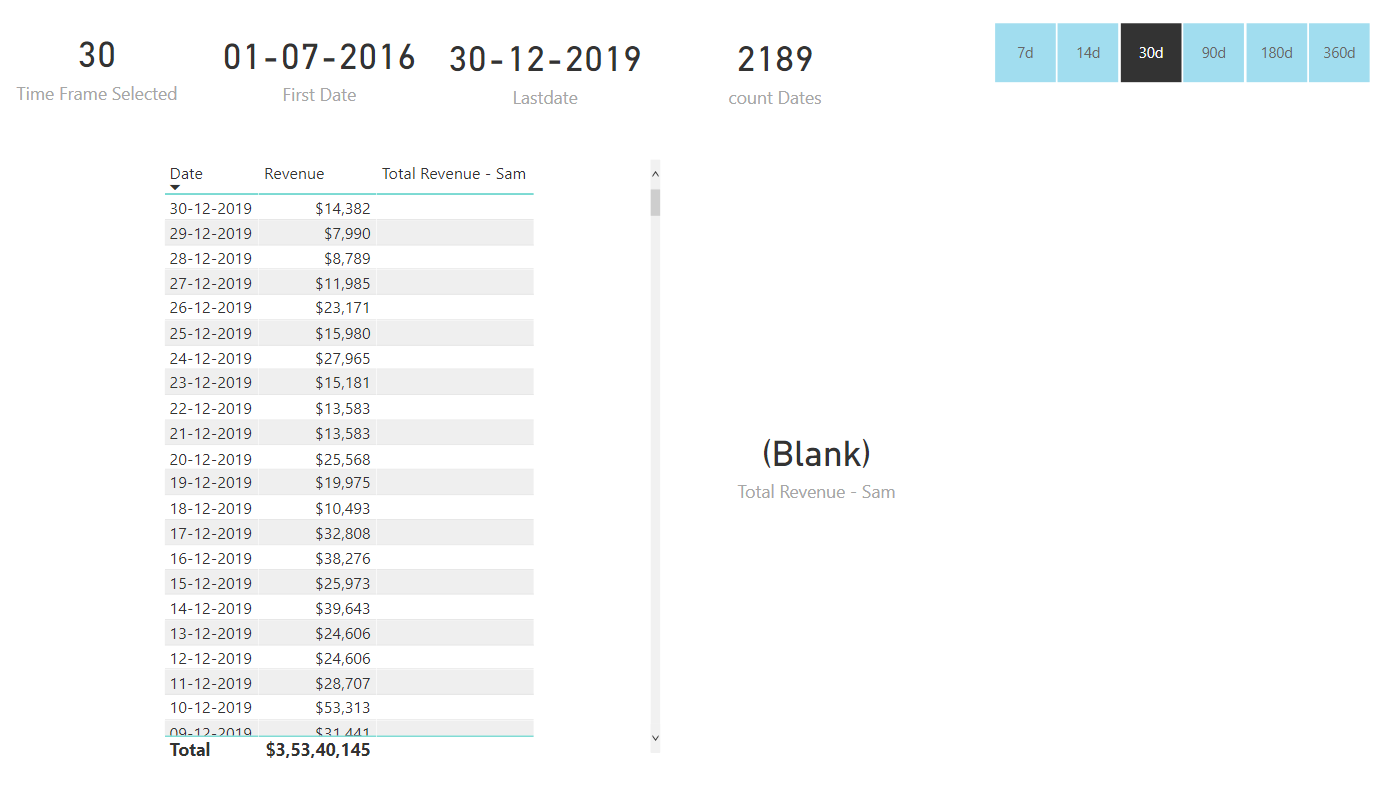
If you observe the formula, it contains the context of “TODAY()” function. This function is only relevant if you’ve data as well as date table till today but in the file data point is till “30th December, 2019” and date table is ending on “30th December, 2020” whereas today is “19th February, 2021” so this formula doesn’t makes sense and will by default will show the blanks as a result. Below is the screenshot provided for the reference -
Now, to add to this, you created your formula based on Sam Sir’s formula which is already providing blanks as a results rather than correcting the initial formula itself. Below is your formula provided for the reference and we can clearly see that it’s based on Sam Sir’s formula -
Revenue within Time Frame =
CALCULATE( [Total Revenue - Sam] ,
    FILTER( Dates ,
        Dates[Date] <= LASTDATE( Dates[Date] ) &&
        Dates[Date] >= ( LASTDATE( Dates[Date] ) - [Time Frame Selected] ) ) )
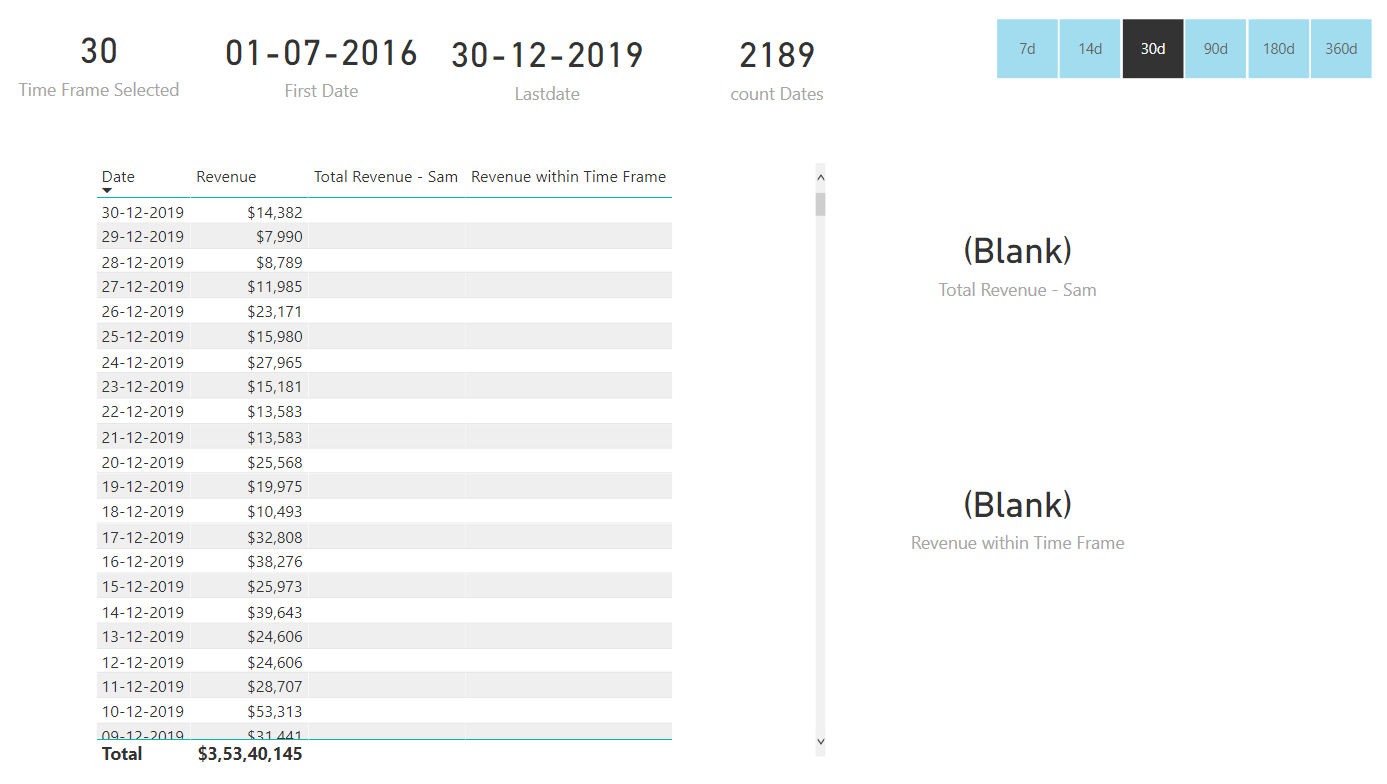
So by default you’ll also get the blanks as a results. Below is the screenshot provided for the reference -
So ideally you were just required to correct the inital formula which Sam Sir has created and it would have provided the correct results. So if you observe the Sam Sir’s formula it contains the measure “Total Days” so firstly you’ll be required to correct that formula. Here’s the original formula (Later on in the post I’ll tell you why I corrected this formula) -
Total Days =
IF( HASONEVALUE( 'Date Ranges'[Time Frame] ) ,
       VALUES( 'Date Ranges'[Days] ) ,
       COUNTROWS( Dates ) )
But ideally it will be “COUNTROWS( ALL( Dates ) )” because as you mentioned - “if nothing is selected into the slicer of date range than it should show the results for entire period”. So revised formula will be as follows -
Total Days =
IF( HASONEVALUE( 'Date Ranges'[Time Frame] ) ,
    VALUES( 'Date Ranges'[Days] ) ,
    COUNTROWS( ALL( Dates ) ) )
And now here comes the main part, where you should’ve corrected the primary formula rather than creating your own formula. Below is the formula provided for the reference -
Total Revenue - Sam =
VAR LastTransactionDate =
CALCULATE( LASTDATE( Sales[Purchase Date] ) ,
    ALL( Sales ) )

RETURN
CALCULATE( [Revenue] ,
	FILTER( Dates ,
		Dates[Date] <= LastTransactionDate &&
        Dates[Date] >= LastTransactionDate - [Total Days] ) )
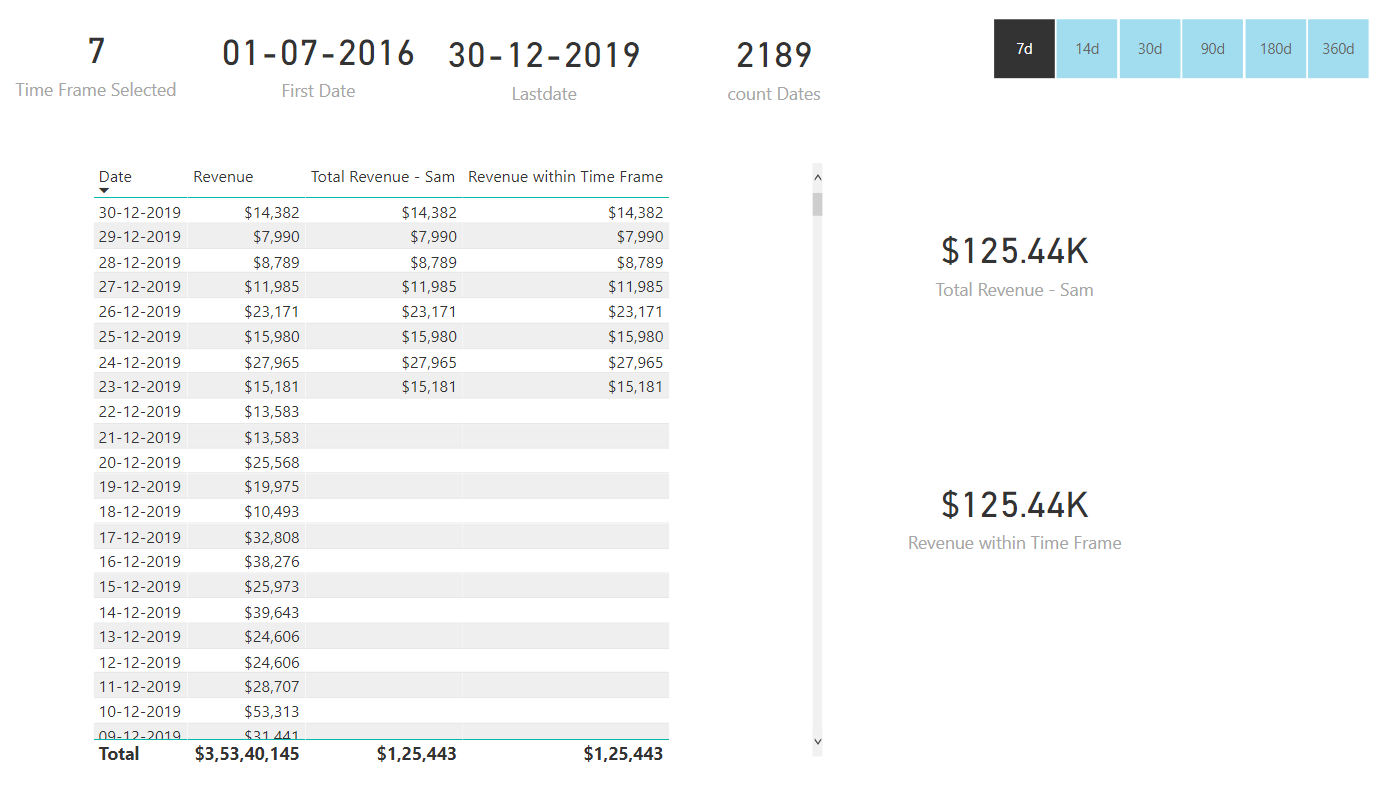
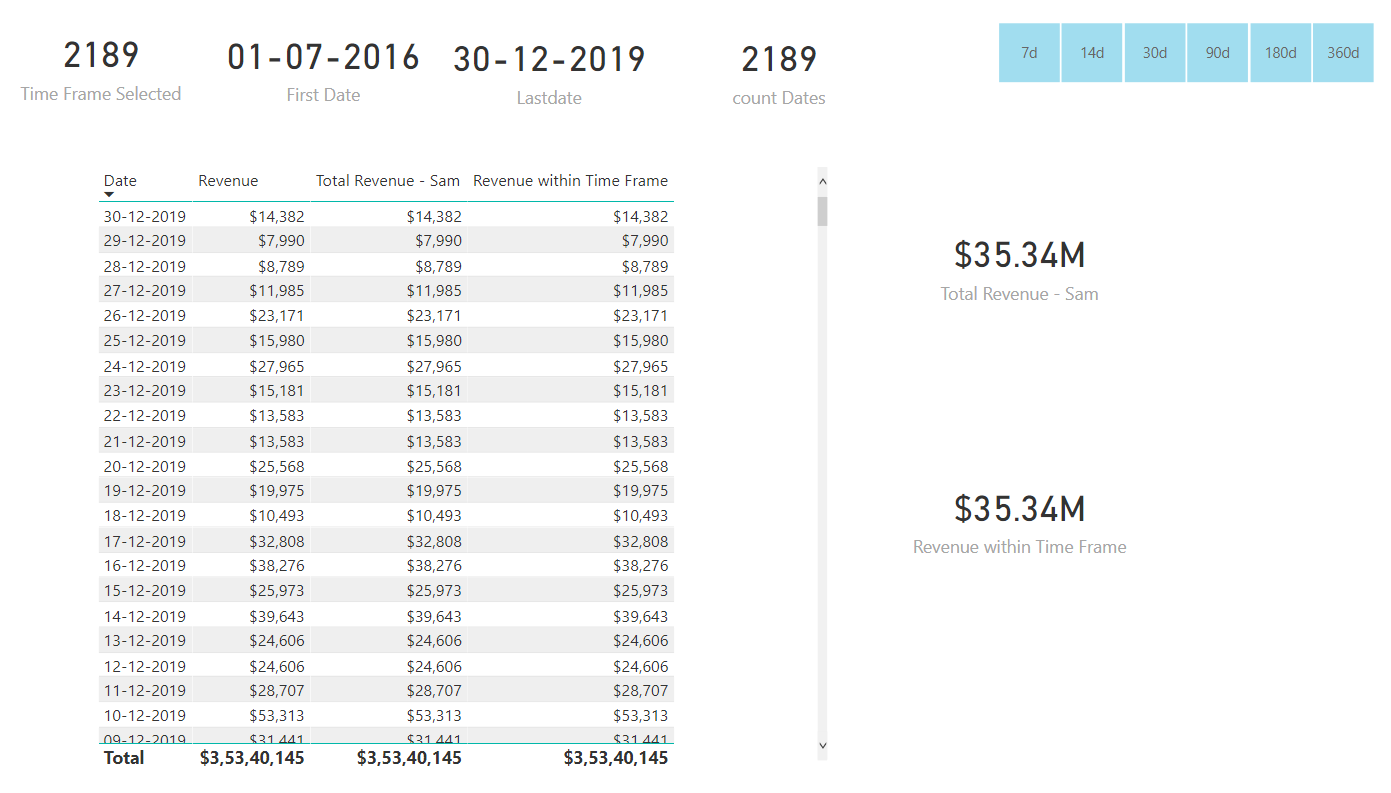
Now see the results. Below is the screenshot provided for the reference -
Conclusion: As you can see in the above screenshot, both the formulas provided the identical results. So had you just changed the context properly in the original formula which Sam Sir had created than there was absolutely no requirement of yours to create a new formula which you did.
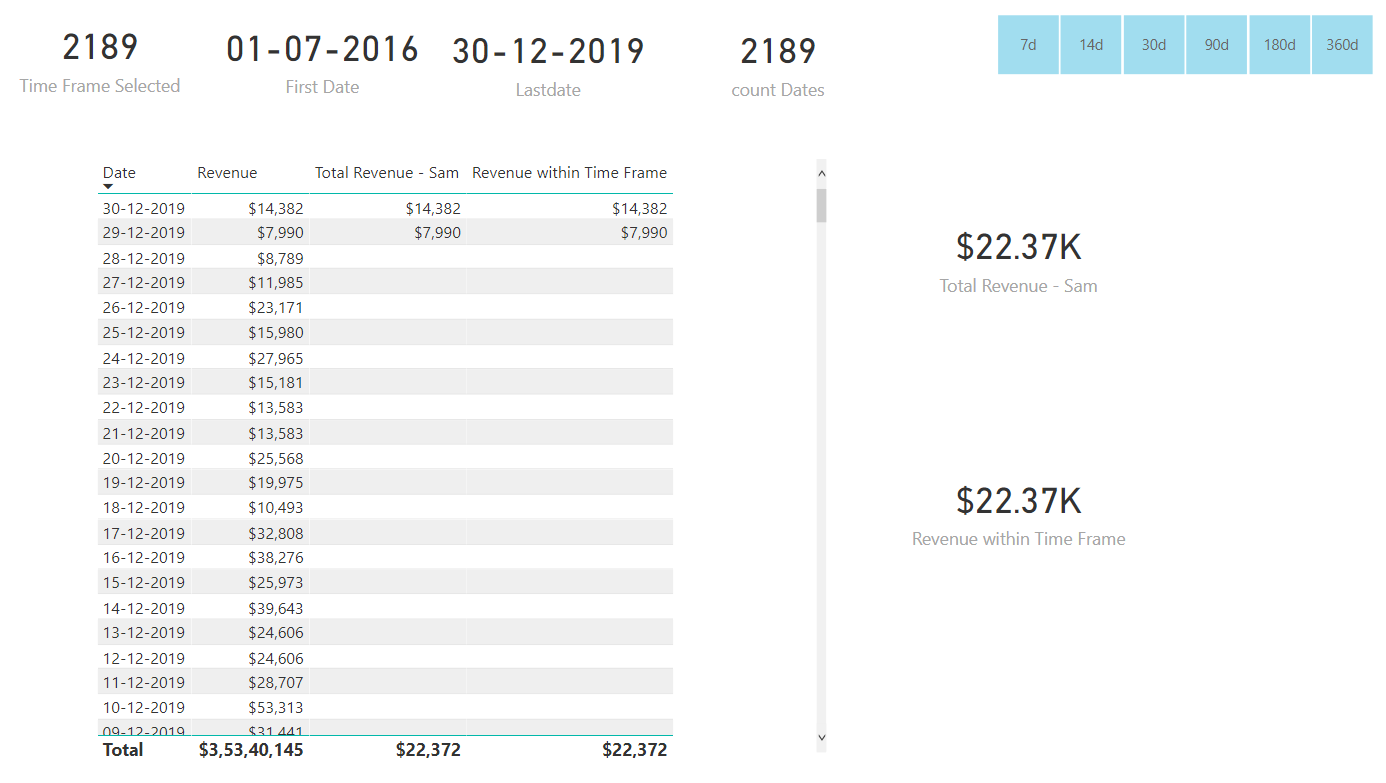
Lastly, as promised to you earlier I’ll provide you the reason about why I changed the “Total Days” formula. So had I not added the “ALL()” function into it and if we don’t select any range into the slicer see how the results actually looks like. Below is the screenshot provided for the reference -
And therefore I added the “ALL()” function to incorporate the requirements into the results that you’ve stated. See now how the results looks like after adding the “ALL()” function into the “Total Days” measure. Below is the screenshot provided for the reference -
I’m also attaching the working of the PBIX file for the reference.
Important Learnings: Whenever we build new or secondary measures/formulas always go and check the primary formulas since they’re the ones that can make or break the analysis.
Hoping you find this useful and meets your requirements for analysis that you’ve been looking for. 
Thanks and Warm Regards,
Harsh
Retail Sites - Harsh.pbix (577.7 KB)