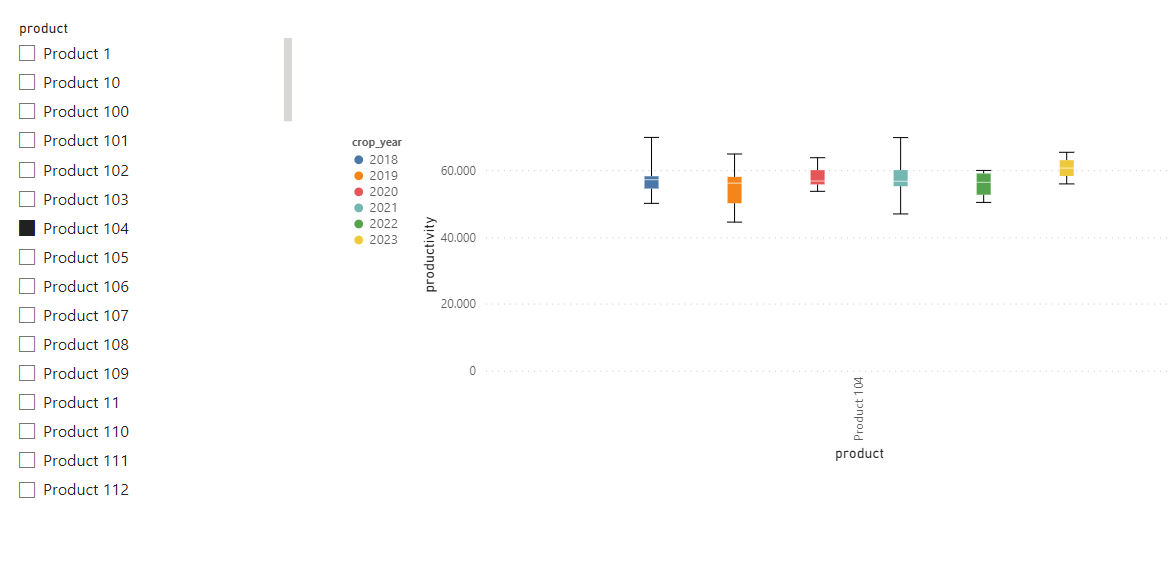
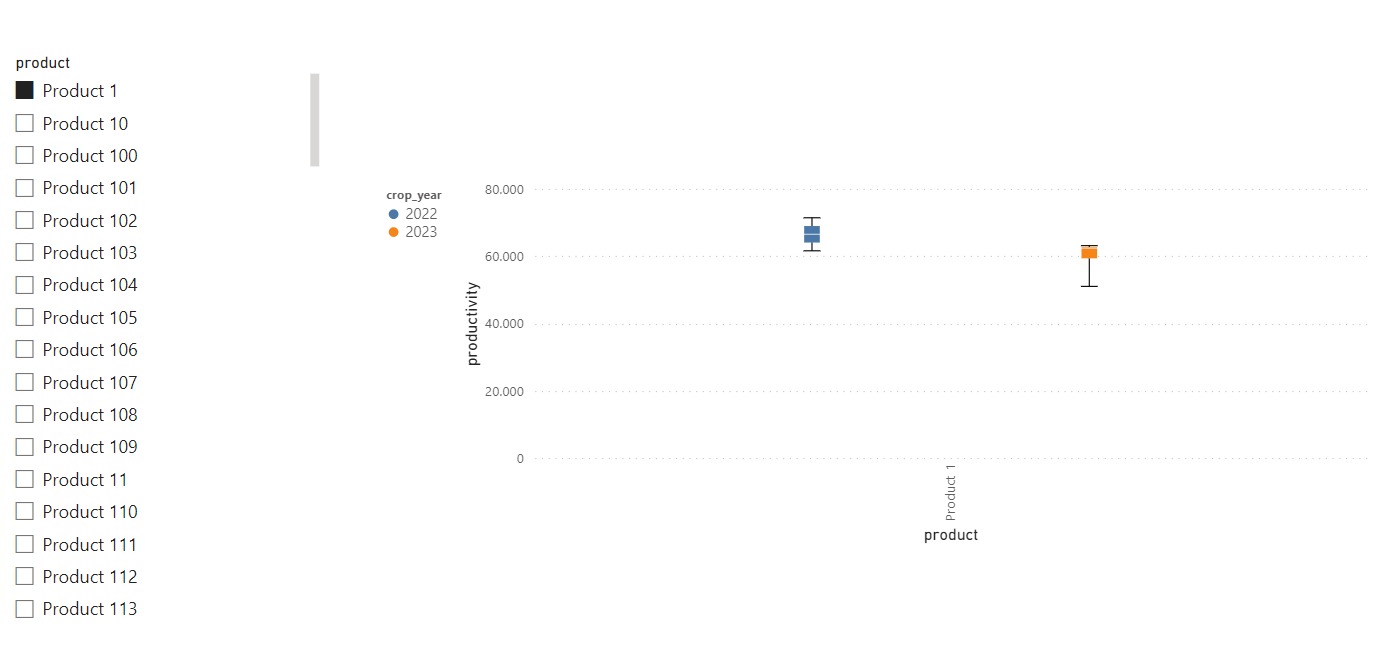
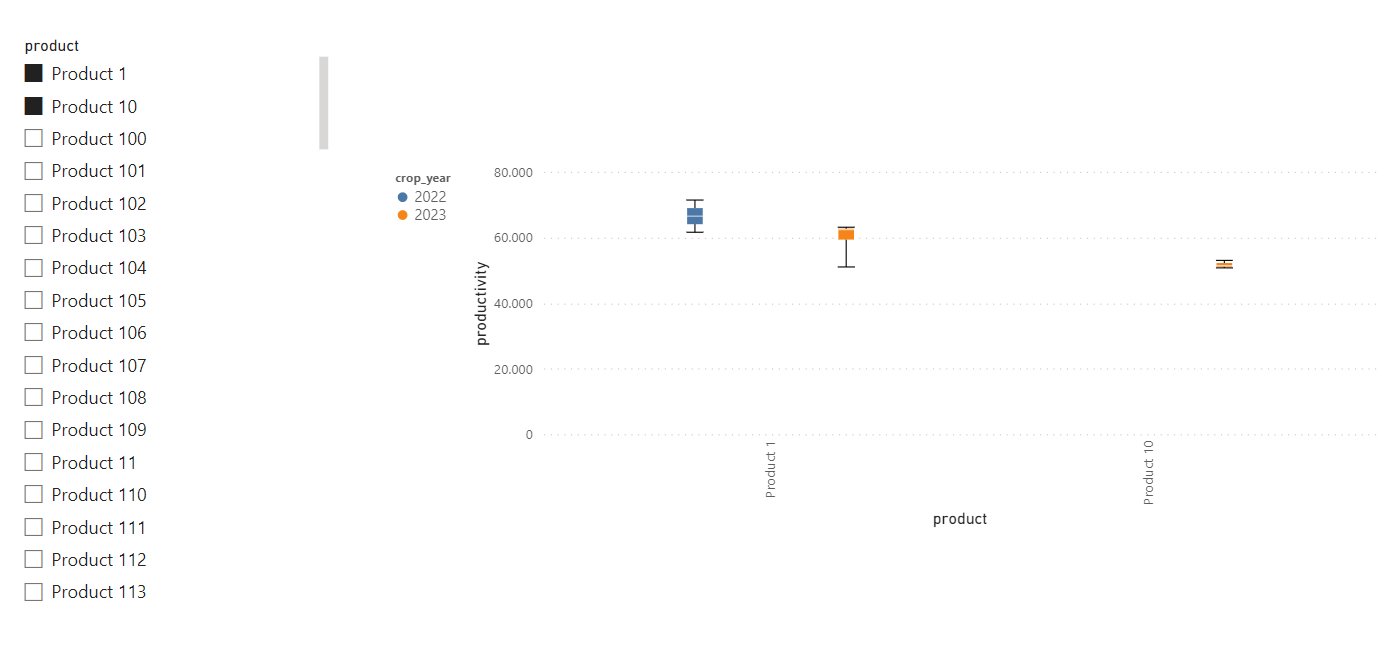
I have a visual box plot with deneb on my dashboard that displays productivity by product, categorized by year. It’s a visualization that includes many products, as you can see. On this page, users can select many products. However, when selecting one or a few, the box plot is shifted to the left and not centered as it should be. I’ve already tried using autosize, but since we have many products, I need to define the width with steps, and in this case, autosize does not apply. When selecting all products, I need to maintain the correct spacing, and when I select just one product or a few, the size is readjusted. How could I solve this problem?
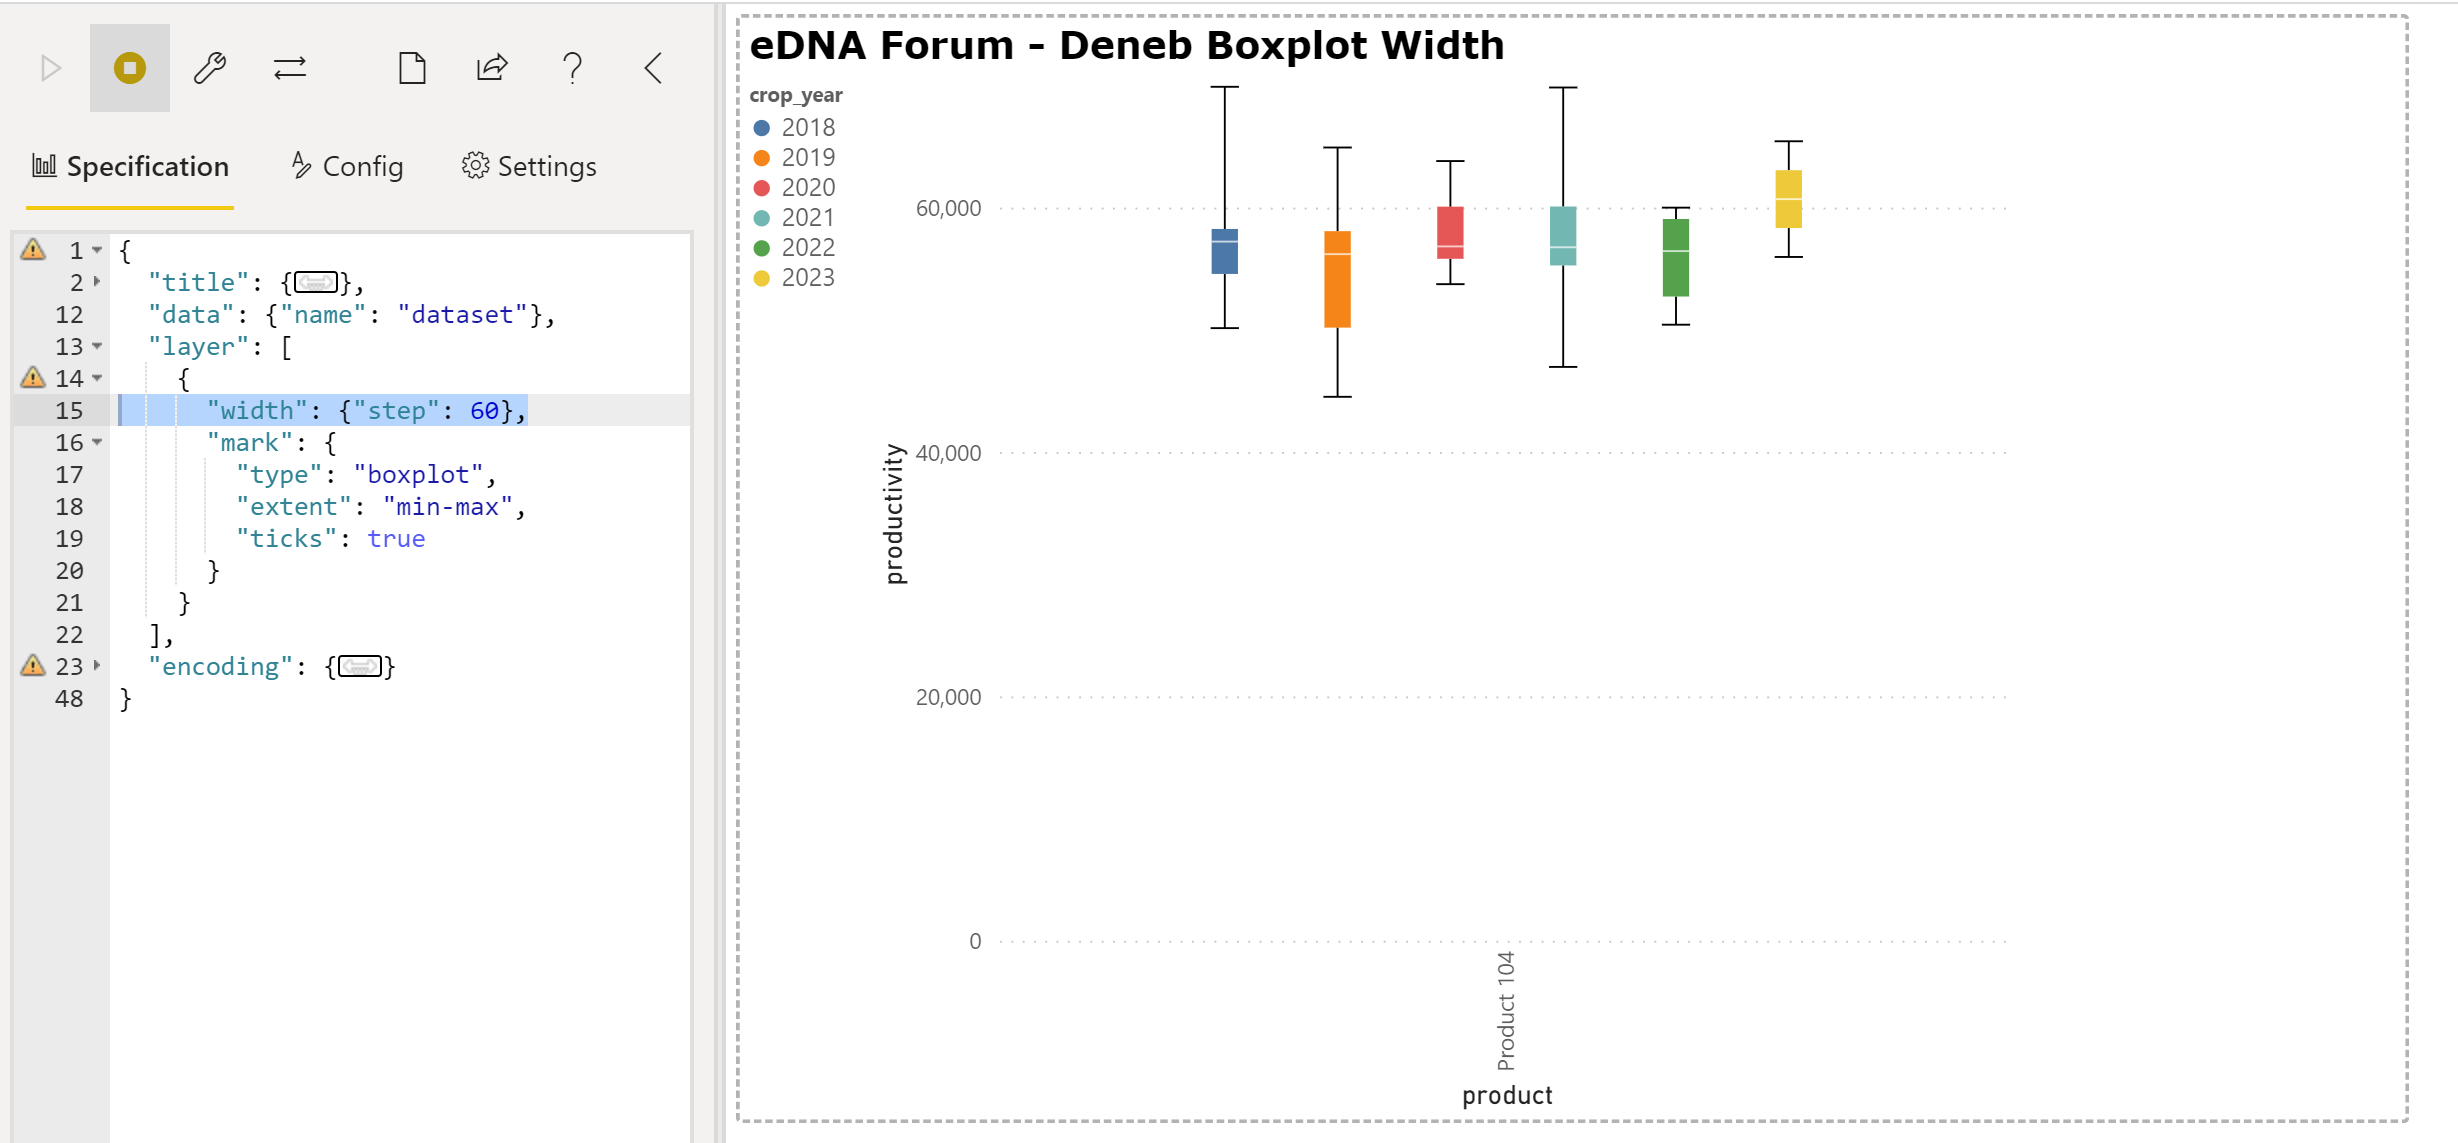
I’m sure I’m missing something and don’t get your issue correctly. From what I understand so far, you want to set the width of each “step” in the boxplot; you already have a “width”: {“step”: 15} in your Vega-Lite JSON, so I simply adjusted the value.
(Also, as both your “Problem” and “Mockup” pages were Deneb, I’m not sure which one to use as a base, so chose “Problem”.)
I doubt this solves your issue, and perhaps a couple of marked-up screenshots showing what your desired outcome is both when 1 product is selected and when multiple products are selected would help to clarify.
If I select just one product, it should appear centered and not on the left as I showed in the first mockup.
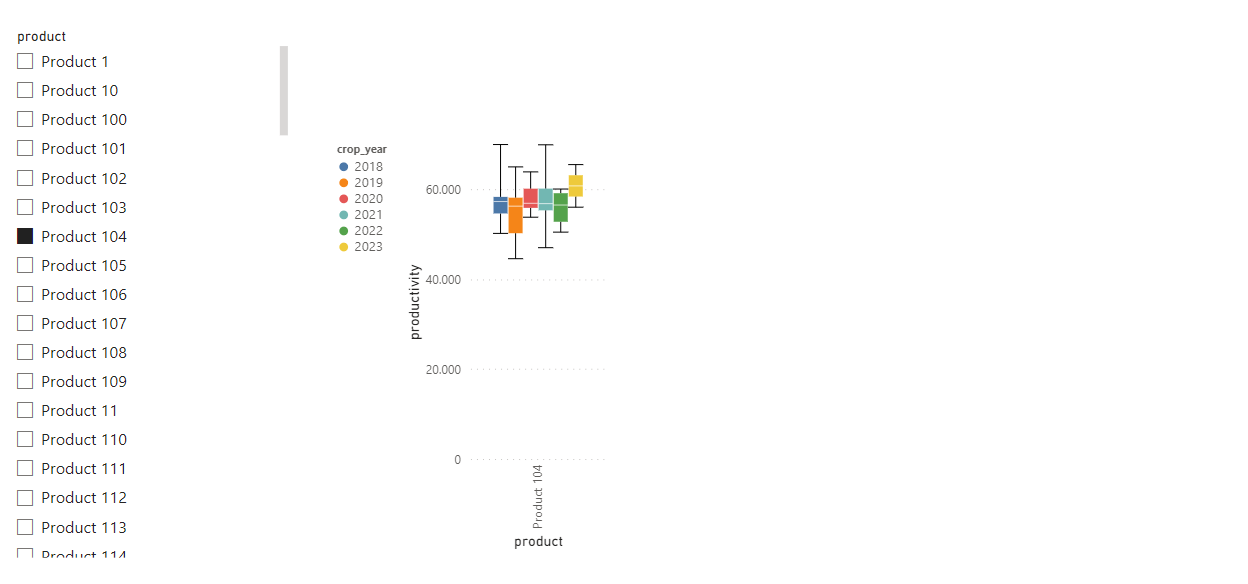
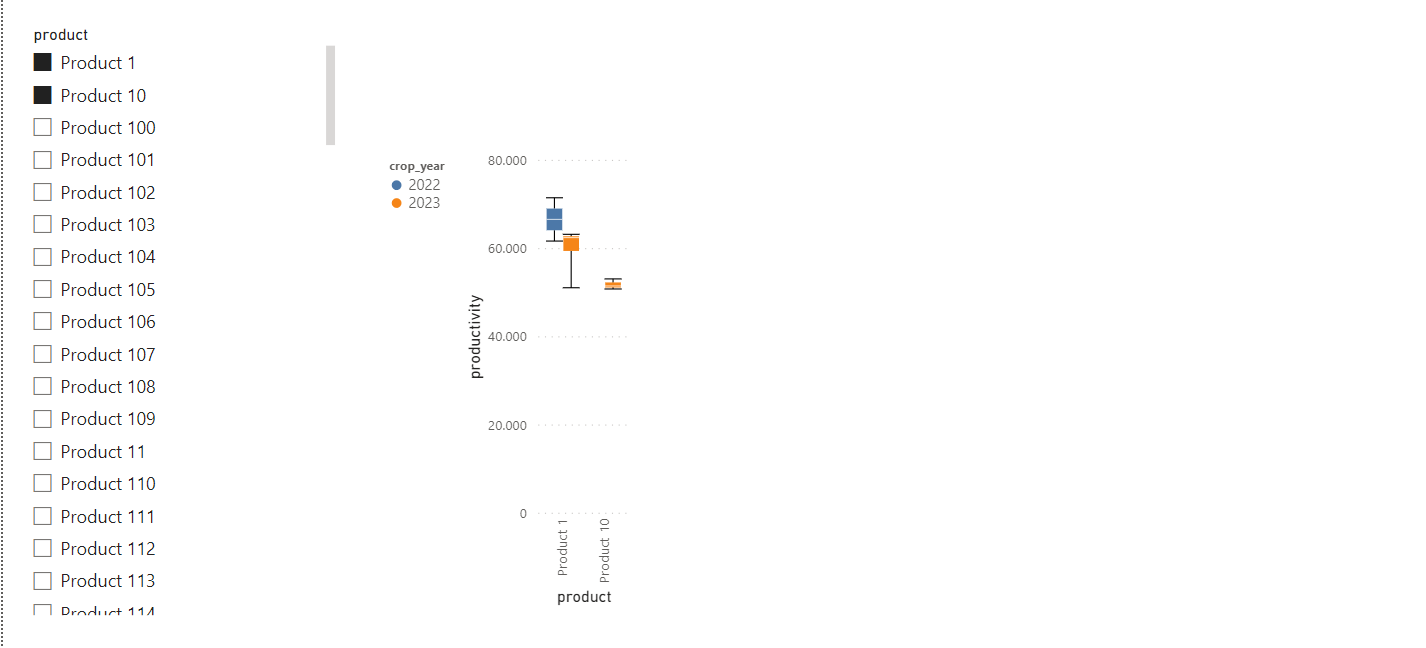
So if I select just one product it is in the middle like the image below:
Hi @renatamorcs. OK, not sure how to (or if I can) do variable step width based on the number of products selected. To help the investigation, can you please construct a dimensional data model with a proper [Products] dimension and [Crop] fact table, or upload your dataset?
If so, just remove the “width-step-value” line from your code to get Vega-Lite to automatically center the selected products and calculate the step size.
Hi Greg!!
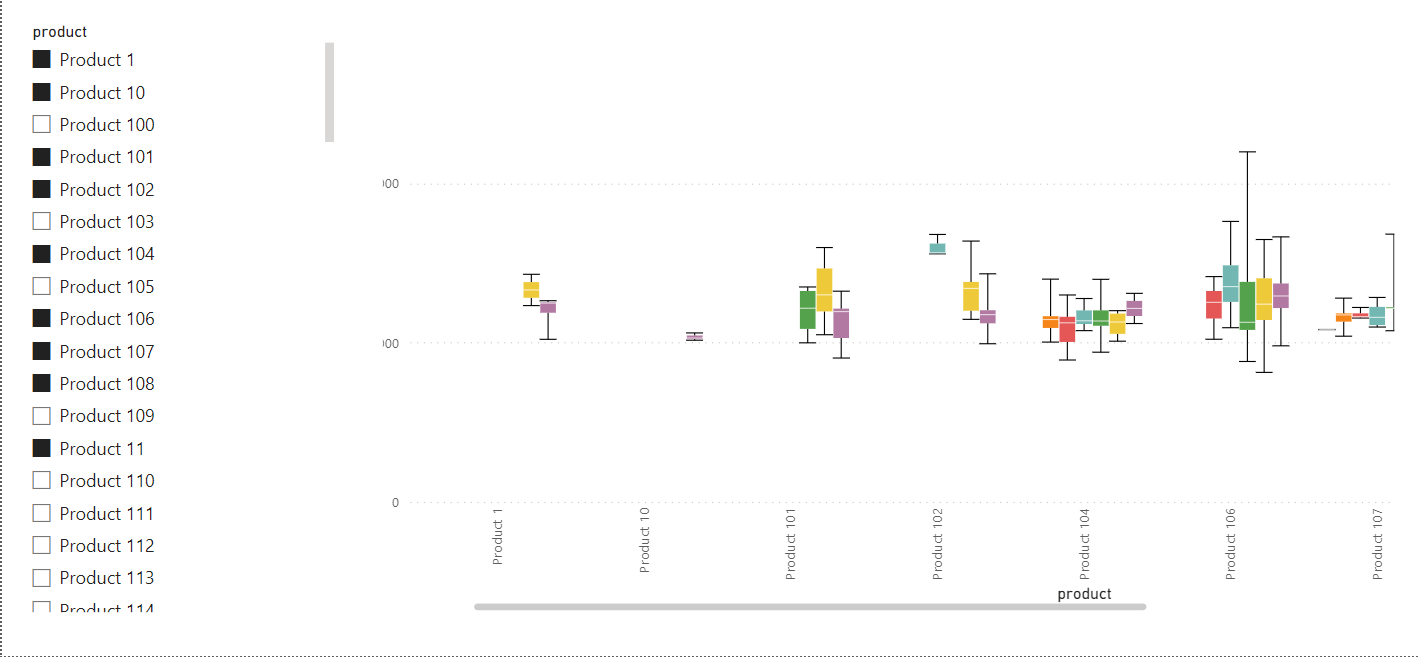
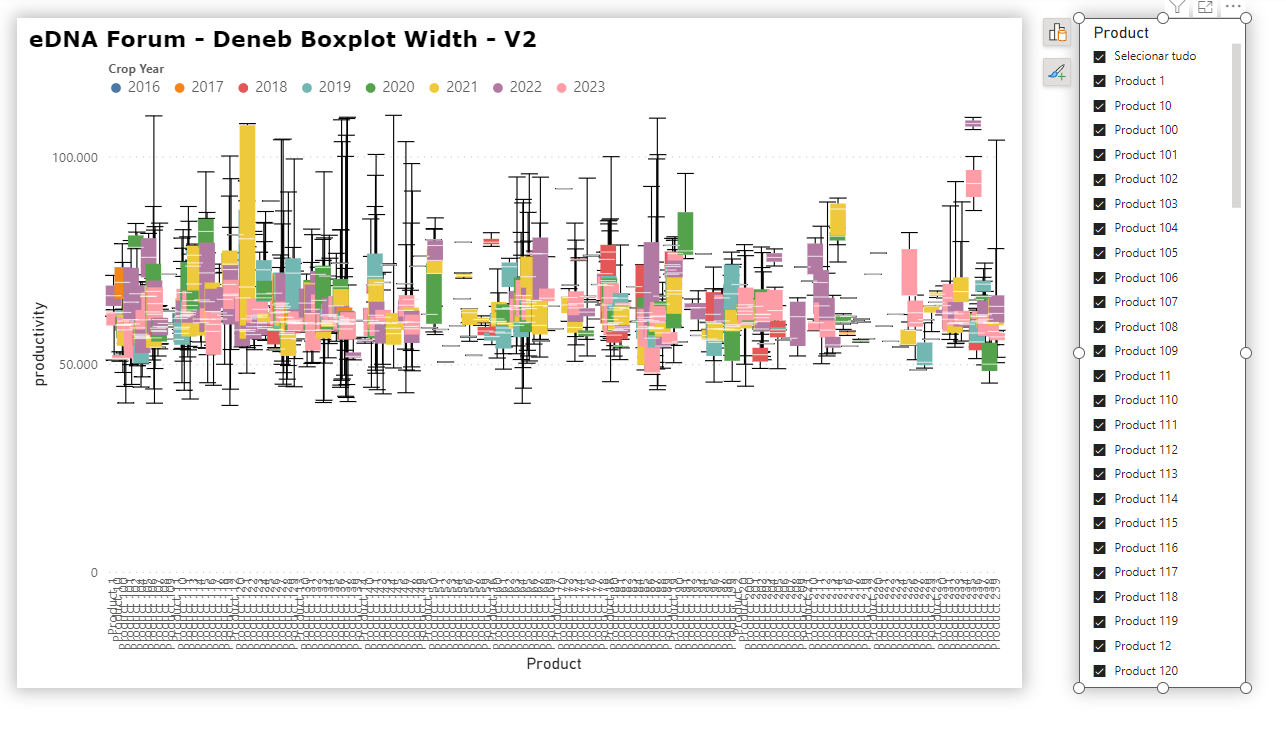
Kind of … but still I need the user will be able select all products like the image bellow and that the chart size will be resize too. In this case, this is not happened without widht step defined … I thought that had other way for resolve this perhaps with what you said about divide the width with the count the products
I had thought that Vega-Lite might permit an expression as width-step-expression but can only get width-step-value to work, so AFAIK it looks like you can’t have it both ways.
On first glance, I can’t see how selecting all products would help the user to make a decision, so perhaps stating that the visual should be limited to no more than, say, 5 products might be an option; you can then use the width-container syntax to automatically center and set the step size (but the visual will not scroll).
You could then possibly add a different visual to display, for example, a bar chart of the maximum productivity of all products to help the user determine which products to select.