hi all…newbie here and an accountant learning how BI works.
i’ve developed a report showing new customers with the following code
New Customers =
VAR CustomerTM = VALUES('Customer Invoice Report (A'[To])
VAR PriorCustomers =
FILTER(
CustomerTM,
CALCULATE (
    MIN('Customer Invoice Report (A'[Date]),
    ALL(Dates)
    )<MIN (Dates[Date])
    )
RETURN
everything seems to work well on the month by year and drilldown day by month
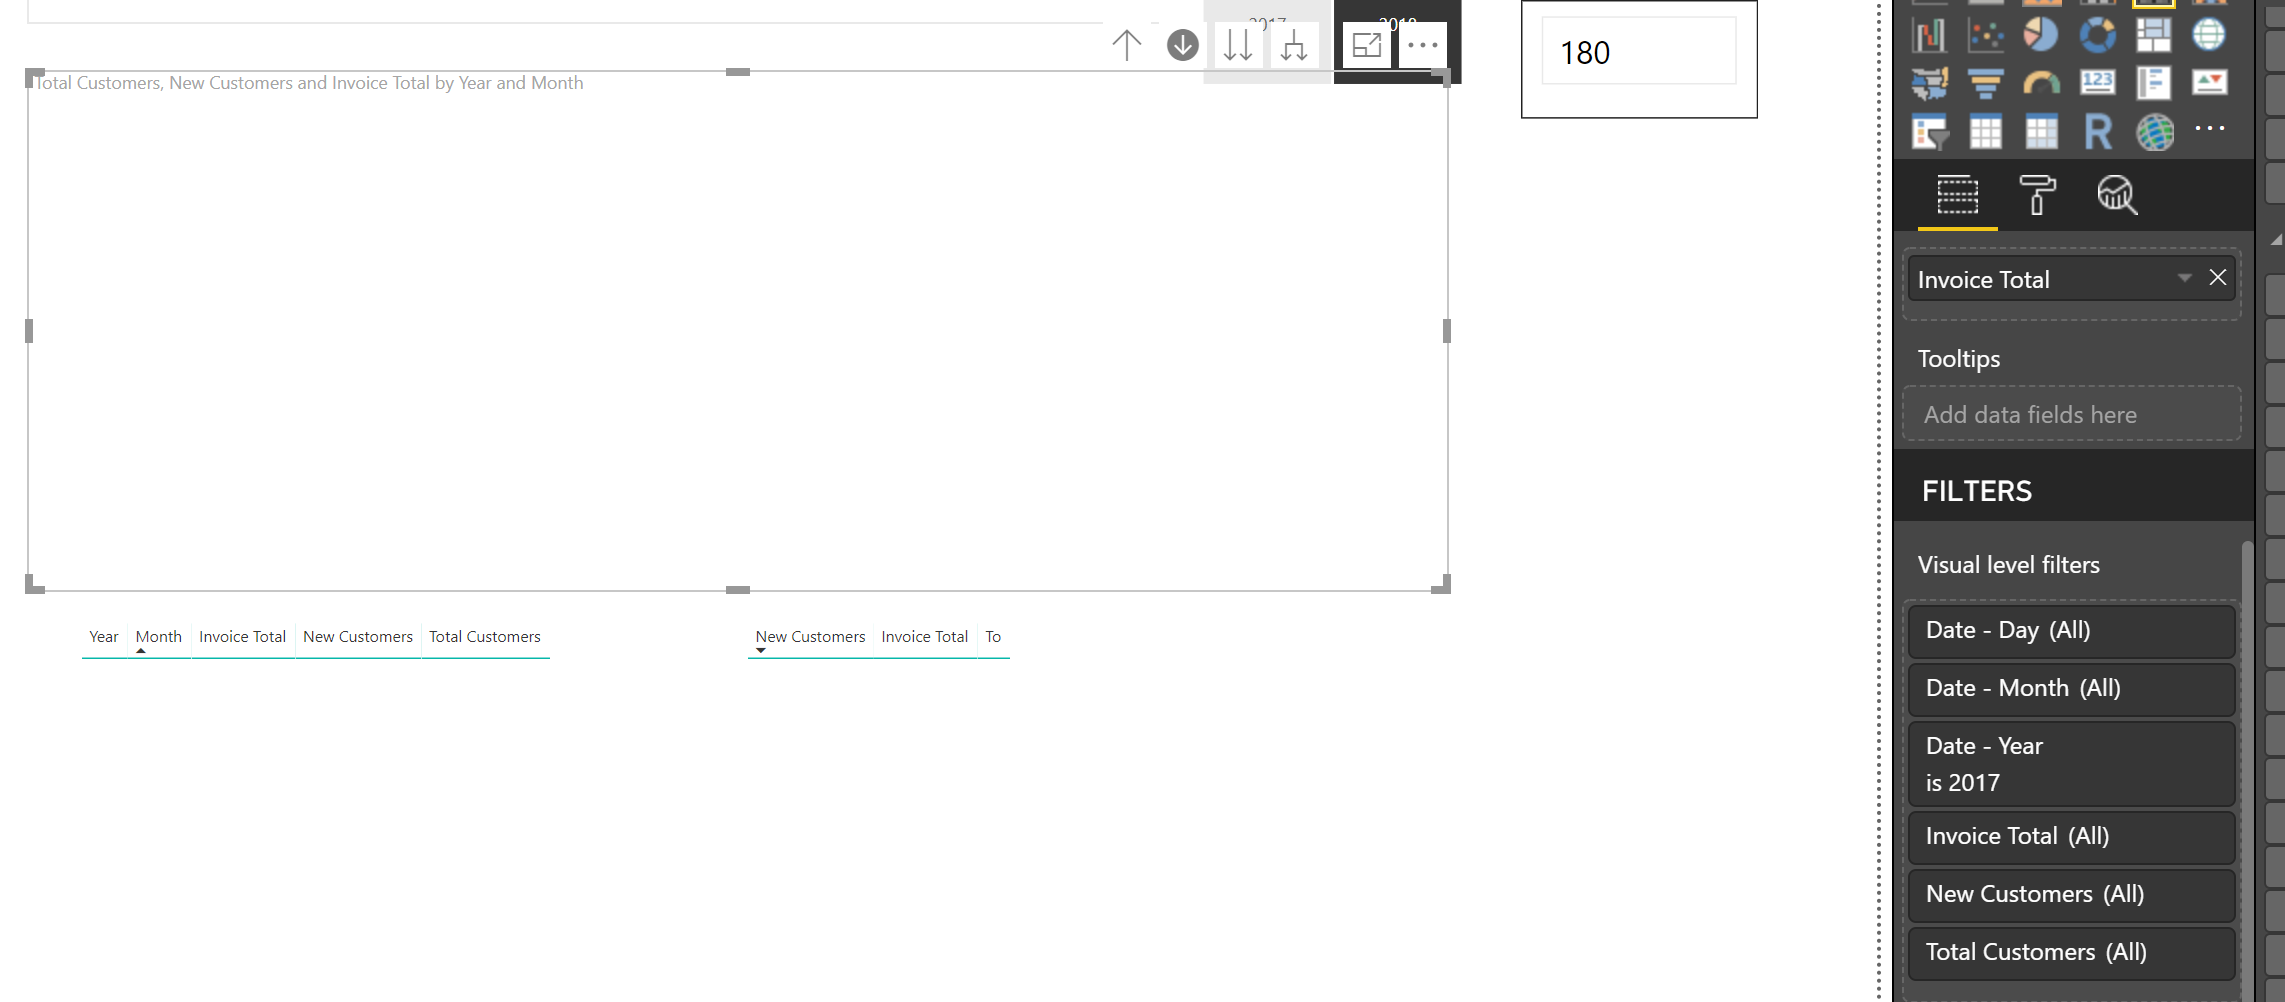
i have a year slicer up the top
when i click on 2018 the data appears. when clicking on 2017 i get a blank report screen despite there being data
not sure what im doing wrong
Can you have a look through this video and look into this technique.
This is a revised one which is better.
Just review how I have set it up and then applied the formula to it.
I think this should help you get to what you need.
Here’s also a deeper dive into attrition analysis which was a recent member only event
There some good resources you can download in the above linked workshop. It has all the formulas in there that you can look to transfer over to your model
sam that code works like a dream and ive got the churn rate working well (thanks)
might not be explaining myself well.
i select 2017 and the report graphs show correctly with the correct date. i can then drill down and see the daily results and works well
however when i click the 2018 slicer it displays nothing. it seems to be keeping the 2018 as a visual level filter
i can click the erase button (on the visual level filters) and the 2018 data shows but i want it to work dynamically. not sure what im doing wrong
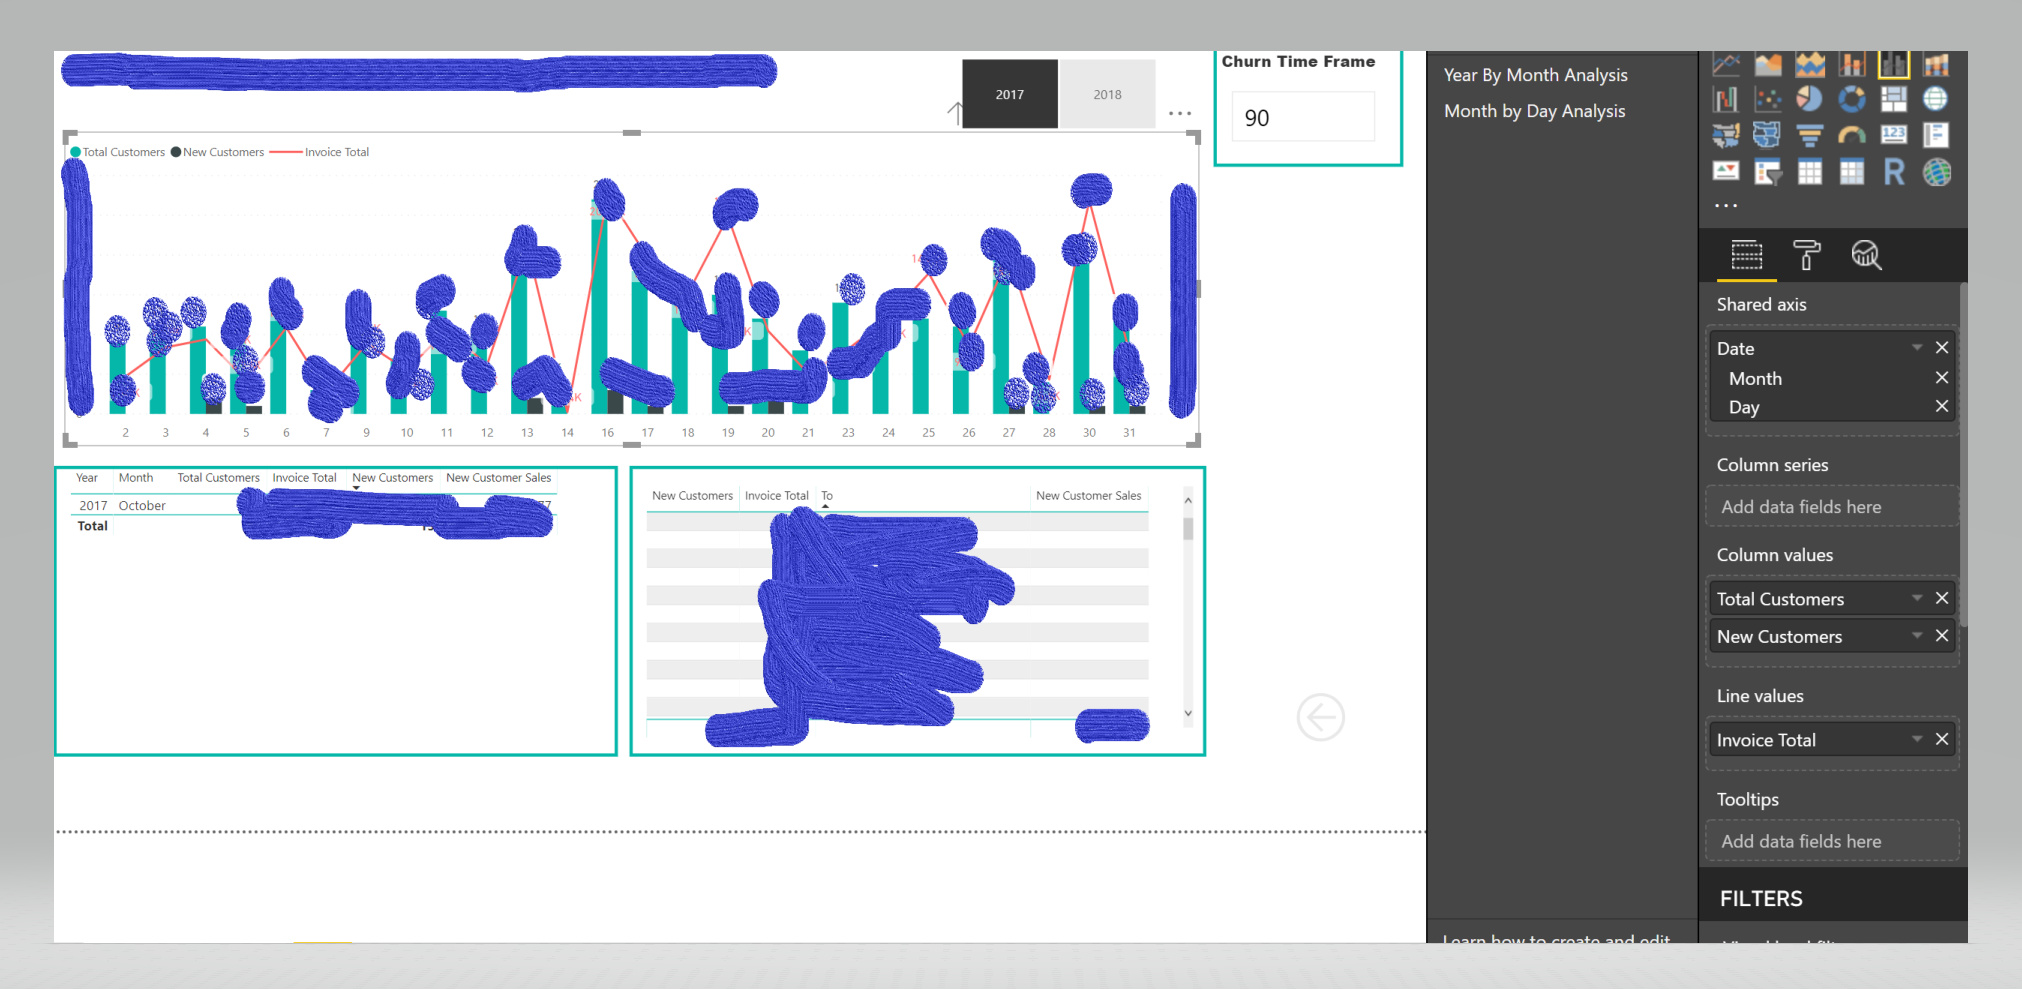
Really with the filter in your chart should not have a date hierarchy. That specific formula is set up to work with a month & year column.
Try not to use the visual level filter for this also
Place the year filters (or any date filters) actually in the report page so you can dynamically click around.
What exactly are you trying to showcase?
With formula like this I recommend keeping it simple. It can get advanced quick and getting lost can be quite easy.
Definitely the hierarchy on the date is not a good idea. Swap that out for the month & year.
If you want a different time frame then the formula would have to be different.
Chrs
ok understanding more how the filters work.
ive created a report which shows the news customers by month and year and put the year as a report level filter and when switching it works on that report (great)
from reading through things i think i now need to create a new report page which will then show the month and year on that seperate report.
basically what i want to do is take the monthly summary and then allow the user to drill down and see the results by month for a particular year.
im not sure how to link the first report to the second report. this might be covered in one of your training videos and would love a link if that is so.
thanks for all your help for us newbies and non techies
ok got it to work
what i did was to have the hierarcy as month and day
then use the year filter at the top
now when i drill down (to the month by day) and across years it filters it correctly