I am currently working on a new PBI Central Data Model (CDM). One of the issues I am addressing is creating a “Reports To & Seller” slicer hierarchy. Due to the number of slicers on the report, I have combined these two fields, which has led to the need to ensure they function correctly together.
Here is a snapshot of the slicer. The first field is “Reports To” and the second is “Full Name,” both of which are from the Users table. For confidentiality reasons, last names have been excluded from the snapshot.
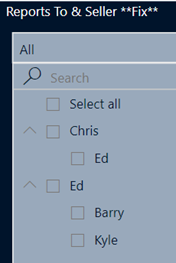
Currently, if I want to search for opportunities for Ed’s team, I have to select both Ed and Chris. Ed has two users reporting to him, and Ed reports to Chris. The desired result is that if I search for Ed, it will display Ed and the two users who report to him. If I search for Chris, it will show Chris and Ed.
Has anyone created a similar hierarchy? I am unable to add additional fields to the user profile, so I need to find a way to implement this in PBI, if possible.
Thank you in advance for looking at my post.
Hi @shemar.rath ,
To address your issue with the “Reports To & Seller” slicer hierarchy in Power BI, you can create a DAX measure or calculated column that identifies the hierarchy and dynamically filters based on the selected user.
Create a new calculated column to establish the hierarchy:
DAX
ReportsToHierarchy =
VAR CurrentUser = Users[FullName]
VAR CurrentReportsTo = Users[ReportsTo]
RETURN
IF(
ISBLANK(CurrentReportsTo),
CurrentUser,
CurrentUser & " > " & CurrentReportsTo
)
Adjust your slicer to use this new hierarchy column:
Add the ReportsToHierarchy calculated column to your slicer.
This will allow you to select a user and automatically include all users reporting up through the hierarchy.
DAX Measure to filter the slicer selection dynamically:
DAX
SelectedUsers =
VAR SelectedUser = SELECTEDVALUE(Users[FullName])
RETURN
CALCULATETABLE(
Users,
FILTER(
Users,
Users[FullName] = SelectedUser || Users[ReportsTo] = SelectedUser
)
)
Apply this measure to your visuals:
Use this measure as a filter in your visualizations to dynamically adjust based on the hierarchy selection.
For more detailed queries or specific implementations, consider exploring the Data Mentor site for additional solutions tailored to your needs.
Cheers,
Enterprise DNA Support Team