I am trying to build a report that shows in this month or trend over time:
Number of New Retailer,
Number of New Consignment,
Number of Unsuccessful Consignment,
Number of Successful Consignment also counted as New Retailer. But I need to know Number of Successful Consignment to calculate converting rate over time.
Details of definition:
How many NEW RETAILER? My definition of NEW RETAILER is first time order, and paid on the same order date (or paid within 7 days after order date)
How many NEW CONSIGNMENT? My definition of NEW CONSIGNMENT is first time order, and not paid on the same order date (or paid later than 7 days after order date) (or the paid date column is empty also consider as new consignment)
Over time, if the NEW CONSIGNMENT returns the goods (means they can not sell, and do not want to be my retailer), then consider as NOT SUCCESSFUL CONSIGNMENT.
Over time, if NEW CONSIGNMENT paid money (after more than 7 days), and order 2nd time, the report as SUCCESSFUL CONSIGNMENT and become NEW RETAILER.
Hi @kvuong2010. Thanks for the data. Could you please post your work-in-progress PBIX file and a screenshot or Excel mock-up of your desired outcome to help the forum members visualize and analyze your issue? Also, if you are posting any DAX code, please use the built-in formatter.
Greg
Thanks for posting your question @kvuong2010 To receive a resolution in a timely manner please make sure that you provide all the necessary details on this thread.
Here is a potential list of additional information to include in this thread; demo pbix file, images of the entire scenario you are dealing with, screenshot of the data model, details of how you want to visualize a result, and any other supporting links and details.
Including all of the above and the advice from Greg, will likely enable a quick solution to your question.
I prepare the “Data model”, “Raw data”, and sample of “Report that I wish to see”. I also update my definition as in the Excel file.
PS: I am new to this forum so please kindly guide me how to provide the data that you could support me best.
And that Data model is basically blank as I do not know how to write DAX to provide the report I want.
Hello @kvuong2010, due to the length by which this post has been active, we are tagging it as Solved. For further questions related to this post, please make a new thread. When starting a new post, I suggest linking this thread, provide as much context to a question as possible and include the masked demo pbix file, images of the entire scenario you are dealing with, screenshot of the data model, details of how you want to visualize a result, and any other supporting links and details. Thanks!
I try to follow the instruction in “How Many New Customers Do You Have Each Month - Advanced Power BI Analytics”
----- DAX Start------
New Customers = //calculating which customers within any particular month have purchased but haven’t done so for the last x number of days (ChurnDate)
VAR CustomerTM = VALUES( ‘SalesOrder’[Customer] )
VAR PriorCustomers = CALCULATETABLE( VALUES( ‘SalesOrder’[Customer] ),
FILTER( ALL( ‘0_DIM_Dates’ ),
‘DIM_Dates’[Date] > MIN( ‘DIM_Dates’[Date] ) - [Churn Time Frame Value] &&
‘DIM_Dates’[Date] < MIN( ‘DIM_Dates’[Date] ) ) )
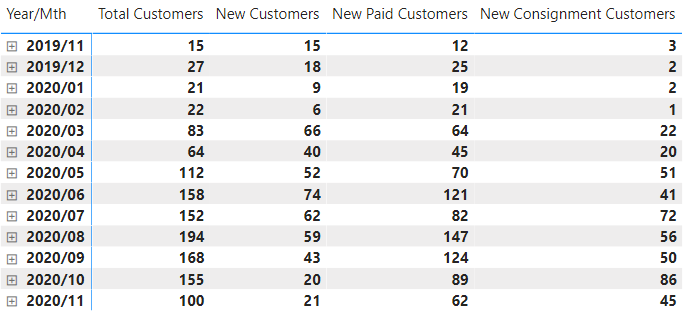
But the result is wrong, I put [Churn Time Frame Value] = 450
and the first month from the DAX shows 15 new customers, but I counted 38 customer in that month (as of course there were 38 new customers).
Then I tried to set up the following for “New Consignment Customers” and “New Paid Customers” but all wrong!
as they dont add up!
Hello @kvuong2010, due to the length by which this post has been active, we are tagging it as Solved. For further questions related to this post, please make a new thread. When starting a new post, I suggest linking this thread, provide as much context to a question as possible and include the masked demo pbix file, images of the entire scenario you are dealing with, screenshot of the data model, details of how you want to visualize a result, and any other supporting links and details. Thanks!