Hi @ammu,
When switching to PBI reporting a lot of the time requests come in to rebuilt/copy ‘old’ excel reports that can be challenging because Excel and Power BI don’t work in the same way AND can also result in leaving a lot of the unique and powerful PBI capabilities underutilized.
If you feel this applies to you, try to manage expectations early on and use the many showcases in the structured learning courses to show alternatives to gain insights fast.
.
Now back to your question.
I created a supporting visualization table with DAX but you could do this in Power Query also (I didn’t in this case because then I’d have to refresh the Query and the fortnight periods would have been off)
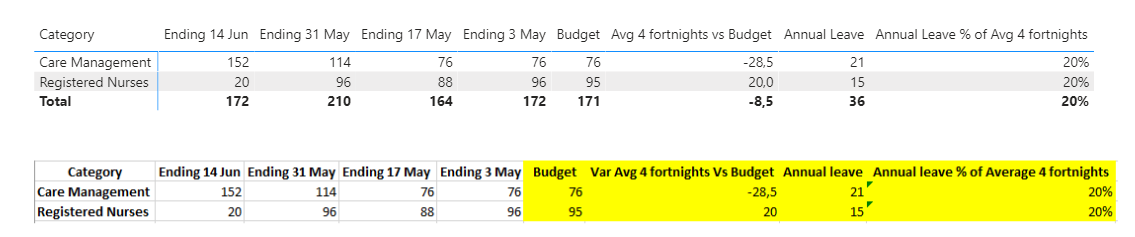
So next I placed this Label field on the Columns of the Matrix visual and created a [Combined Measure] using SWITCH/TRUE logic to assign the correct values.
Combined Measure =
SWITCH( TRUE(),
    SELECTEDVALUE( 'Report visualization'[Value] ) <0, CALCULATE( [Total Value], FILTER( Dates, Dates[ShiftForward] IN VALUES( 'Report visualization'[Label] ))),
    SELECTEDVALUE( 'Report visualization'[Value] ) =1, CALCULATE( SUM( Budget[Value] ), TREATAS( VALUES( Payroll[Category] ), Budget[Category] )),
    SELECTEDVALUE( 'Report visualization'[Value] ) =2, FORMAT( CALCULATE( SUM( Budget[Value] ), TREATAS( VALUES( Payroll[Category] ), Budget[Category] )) -
        DIVIDE( CALCULATE( [Total Value], FILTER( Dates, Dates[Period] <> "Week 0" && Dates[Period] <> BLANK() )), 4 ), "0.0" ),
    SELECTEDVALUE( 'Report visualization'[Value] ) =3, CALCULATE( SUM( 'Annual Leave'[Value] ), TREATAS( VALUES( Payroll[Category] ), 'Annual Leave'[Category] )),
    SELECTEDVALUE( 'Report visualization'[Value] ) =4, FORMAT( DIVIDE( CALCULATE( SUM( 'Annual Leave'[Value] ), TREATAS( VALUES( Payroll[Category] ), 'Annual Leave'[Category] )),
        DIVIDE( CALCULATE( [Total Value], FILTER( Dates, Dates[Period] <> "Week 0" && Dates[Period] <> BLANK() )), 4 )), "0%" ),
    0
)
.
with this result.
I hope this is helpful. Here is my sample file.
eDNA - Report over last 4 fortnights.pbix (138.8 KB)
NOTE.
For other customization options please work through this module…