Good morning,
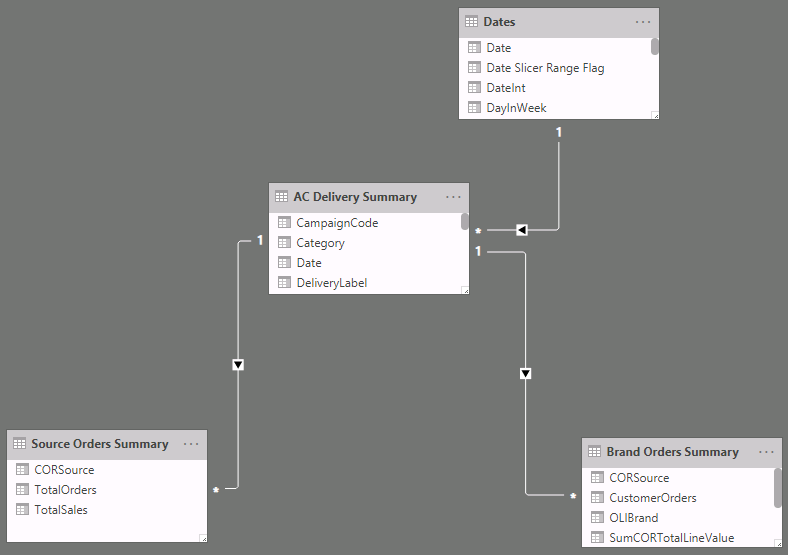
I have a fairly simple data model whereby I have a email campaign table that contains a distinct list of email campaigns (unique Campaign Code) with a series of delivery metrics as columns.
This table is linked (one-many) to a sales table that along with the Campaign Code value, has a related product brand column along with the total order number and value for that product brand and email campaign, i.e. the number/value of specific product sales attributed to that email campaign.
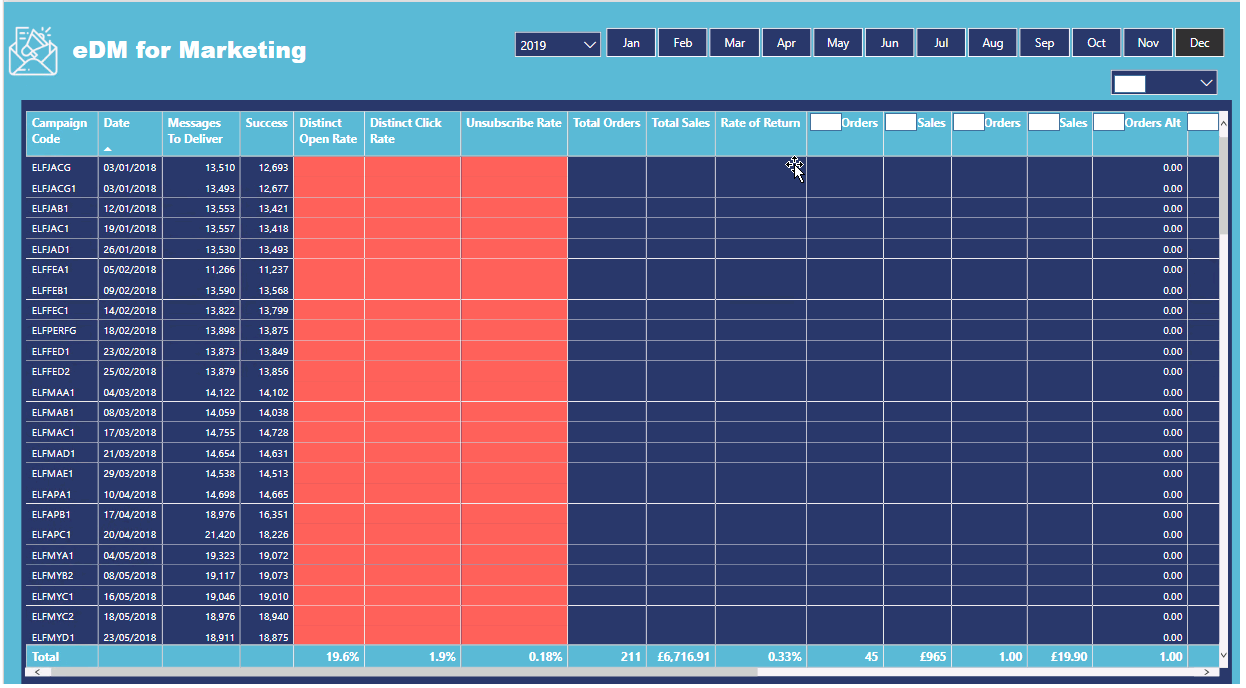
I have created a grid that displays each of the email campaigns as rows together with the delivery metrics as columns and additionally, columns for each of the product showing the aggregate sum totals for both numbers and value sold.
The measure I use for this as follows:
Active Orders = CALCULATE( SUM( ‘Brand Orders Summary’[CustomerOrders] ) , ‘Brand Orders Summary’[OLIBrand] = “ACTIVE” )
This all works well except in some instances there are blank cells for a product against a specific email campign where no sales were attributed.
I want to replace these blank cells and replace them with a ‘0’ and changed the measure to the following to achieve this:
Active Orders Alt = CALCULATE( SUM( ‘Brand Orders Summary’[CustomerOrders] ) , ‘Brand Orders Summary’[OLIBrand] = “ACTIVE” ) + 0
This has the effect of adding additional unwated rows to the grid, seemingly for all records from the underlying ‘Brand Orders Summary’ table rather than those that are applicable based on the year and month slicer selections:
Can anyone please explain why this is happening and how I might resolve it?
Regards
Karl


