Remove Items when using Swtich True

I am using a Balance Sheet template based on the Chart of Accounts.
The Chart of Accounts is used by many companies and it is quite generic.

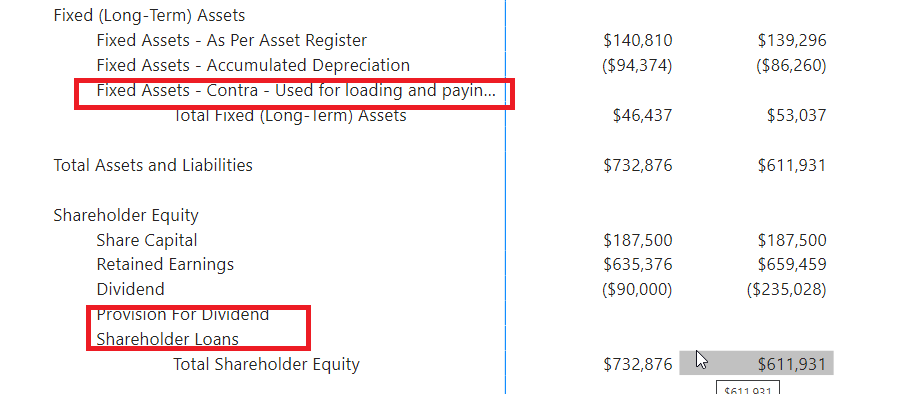
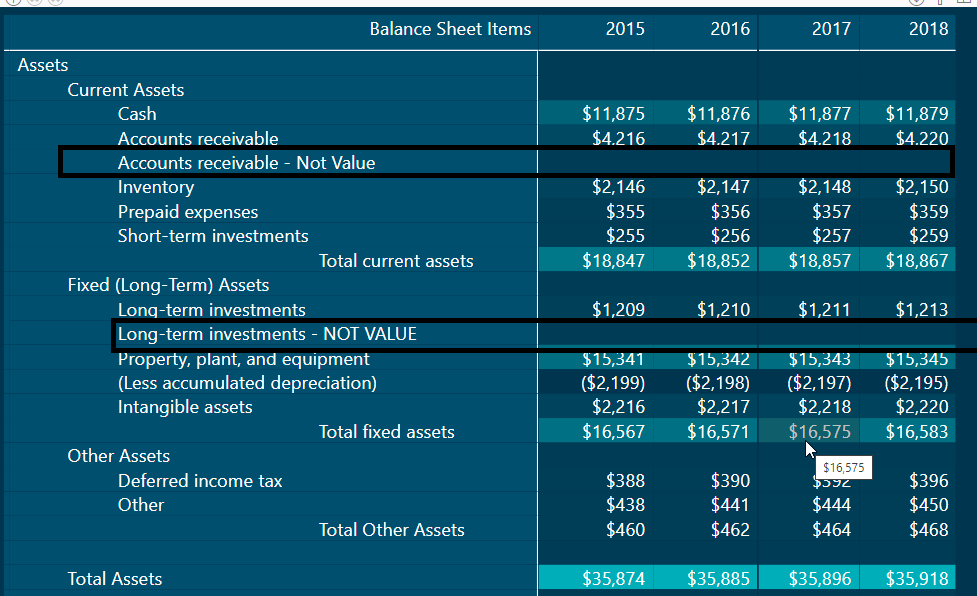
For my reports, I would like to show Only Items that have a value associated (remove those who bring blanks or cero).

My code to bring the data is the following:

Any suggestion?

Thanks in advance,

Hi,

Thanks for posting your query in the form may you pls provide us the pbix file so member from the form help you quickly.

Thanks,
Anurag

No problem,
I have created a couple of rows where there are no values. I would like those not to show on the report.
Attached is the pbix.
Thanks,


Financial Reporting In Power BI_Foro1.pbix (906.3 KB)

Hello @ezenunez,

Thank You for posting your query onto the Forum.

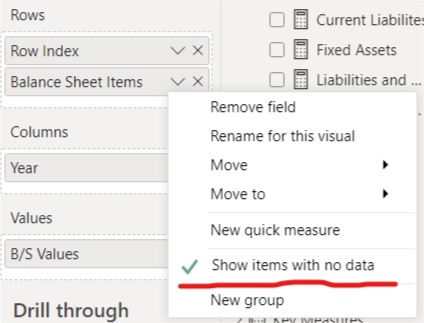
Well, the reason why you’re getting those links as “Blanks” is because you’ve activated or checked the option of “Show items with no data”. Below is the screenshot provided for the reference -

image

So now, even though if you specify in your measure a condition something like this -

IF( ISBLANK( [Measure] ) , BLANK() , [Measure] )

Still it’ll continue to show the blanks and condition specified in your measure or formula will have no effect whatsoever. But now, if you un-check or de-activate the option of “Show items with no data” then in your Financial Reporting format wherever you actually want to show the blanks, they’ll also be longer be visible.

So the best option here is to replace those blanks against the “Category” and “Sub-Category” with “Zero’s (0)”. The main reason being is, in real-life scenario you’ll rarely observe that your entire line is blank. You’ll have data for some years and might not have for few years or months. Then in that case, you’ll not be able to eliminate your entire line and rather replacing “Blanks” with the “Zero’s (0)” is the best option and by doing so you’ll also be able to retain your Financial Reporting template as it is.

So write your measure something like this -

IF( ISBLANK( [Measure] ) , 0 , [Measure] )

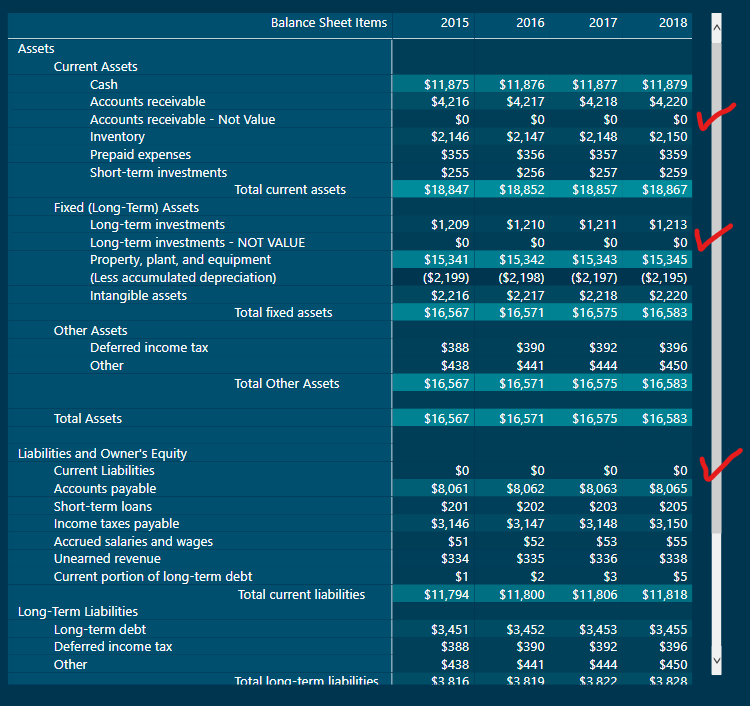
Below is the screenshot of the final results provided for the reference -

I’m also attaching the working of the PBIX file for the reference purposes.

Hoping you find this useful and meets your requirements that you’ve been looking for. :slightly_smiling_face:

Important Note: I’ve observed that you’ve edited the lines of the Financial Reporting Template by adding the lines such as “Not Value” and accordingly I just edited the measure in the file to showcase them as 0’s but the logic will remain entirely the same as I’ve already stated above in the post.

Thanks and Warm Regards,
Harsh

Financial Reporting In Power BI_Foro1 - Harsh.pbix (902.0 KB)

3 Likes

Good Morning Harsh,
Your comments and solution make a lot of sense.

To put in perspective, this chart of accounts is used for multi companies. We have values in some of them but others have very little information. The chart of accounts is quite extensive, which means a lot of blanks…

Same as

image

Even if I replace those with Zero, still not ideal. Do you think there is any other way I can get a nice presentation without showing many " blank or zeros " ?

Many thanks again Harsh,

Cheers,
Ezequiel

Hello @ezenunez,

We have values in some of them but others have very little information. The chart of accounts is quite extensive, which means a lot of blanks…

With regards to this aspect, you got to modify the “Chart of Accounts” based on the different business circumstances and requirements. If have kept or created the standardized the “Chart of Accounts” and using it for all the companies then it’s not ideal scenario here because than “By-Default” it will render the blanks or zero’s as a results, in case of some companies and might not render for some.

For example, Inventory line might be useful for some companies but might also not be useful and relevant for some compaines as well. If company is dealing in tangible products then it’s becomes very useful but it doesn’t mean that service industry doesn’t have any Inventories at all they also does have.

Take the example of “Media and Advertising” industry where they sell the slots of the advertisements to different vendors or partners over different platforms in the form of biddable and non-biddable media. They call these activities as Inventory. So when slots are sold they say - “Inventory Sold” and if it doesn’t get sold out than they say - “Slots or Inventories are pending”.

Other service industry might not have an Inventory at all in their business such as “Consultancy” organizations. Now, to include the Inventory line item in this case or scenario will never make any sense since you’ll always get results as “Blanks” so a wise decision would be to either filter out that result by removing or de-selecting the Inventory line item from the filter pane or not to include that line item directly in your Reporting Template.

Even if I replace those with Zero, still not ideal. Do you think there is any other way I can get a nice presentation without showing many " blank or zeros " ?

Lastly, with regards to this query, the best way in the case of Financial Reporting Template is to design or modify the Templates based on the different business scenario’s and requirements so that you don’t get an un-required blanks as a results. If you expect to use the same template in all the scenario’s then it’s like expecting different results again-and-again by following the same process again-and-again which will never, ever happen.

Since you already have a standardized template in place what you’ll be required to do is modify them i.e. add or remove the line items from the template depending upon the scenario which will hardly take any time ever unless and until you’re required to create a new template for the company which has altogether a new business requirements.

If you don’t wish to edit your template file directly into the source then you’ll have to filter out the results manually and remove those un-necessary records of line items by de-selecting it from the filter pane or you’ll have to write your measure accordingly where you don’t consider those line items at all into the context whatsoever.

So now, I have provided or presented all the scenario’s which can be followed where templates are considered as for “Reporting Analysis”. My recommendation would be to modify your templates so that they meet and adhere to the specific requirements of the business rather than loading the standardized templates directly into the model in Power BI and expecting different results which will not happen.

I hope this clears everything and helps you in your reporting and meets your requirements that you’ve been looking for. :slightly_smiling_face:

Thanks and Warm Regards,
Harsh

Thanks Harsh,
This is a great answer and defenetely agree with you.

These reports are for a " franchise" type of business. It is the same Data Base that is shared accross all companies. The size / operation is quite different and also they have been around for a while. That create some limitation on developing tailor made Chart of Accounts.

I also need to be able to compare performance between companies and branches, so I need same Chart of account.

I have created a different report where I am not able play that much with presentation, but do the job.

I know now the limitation of the good looking reports :slight_smile:

I will use you comments for future reference!

Thanks a lot for your help!

Cheers,
Ezequiel

Hello @ezenunez,

You’re Welcome. :slightly_smiling_face:

I’m glad that I was able to assist and guide you in your query.

Have a great day ahead!!

Thanks and Warm Regards,
Harsh