Hi there, I want to create a KPI where either the Total Revenue or the Total Comm Paid or the % Achieved calculation depending on what is selected in the Calculation Filter, is higher or lower than the Average of all the calculations. I have this calculation:
Hi @SammiP, thanks for providing the pbix file. While waiting for a response, here are some tips so you can get the most out of the forum and other Enterprise DNA resources.
Use the forum search to discover if your query has been asked before by another member.
When posting a topic with formula make sure that it is correctly formatted to preformatted text </>.
Use the proper category that best describes your topic
Provide as much context to a question as possible.
Could you please use the below formula instead, Looks like you are removing filter from the wrong table.
Also note that - You need to remove filters in similar fashion from SalesRep[name] from all masures which are there in your calculation group in order to nullify selection of names from the report .
Hi @Dhrubojit_Goswami, we’ve noticed that no response has been received from you since October 20.
We just want to check if you still need further help with this post? In case there won’t be any activity on it in the next few days, we’ll be tagging this post as Solved.
It landed up changing the entire calc because I couldn’t get it to work. But I need to remove the filters. for the table I am displaying. I don’t know how.
Hi Anurag, I used the Inscope function for something else. What I really want is for the 32,185 to appear at every row for the sales person. But I don’t know which filters to remove. I have tried.
Revenue for Table =
VAR AllTotalRevenue = CALCULATE([Total Applied Revenue],ALL(Commissions_baseTable))
return
AllTotalRevenue
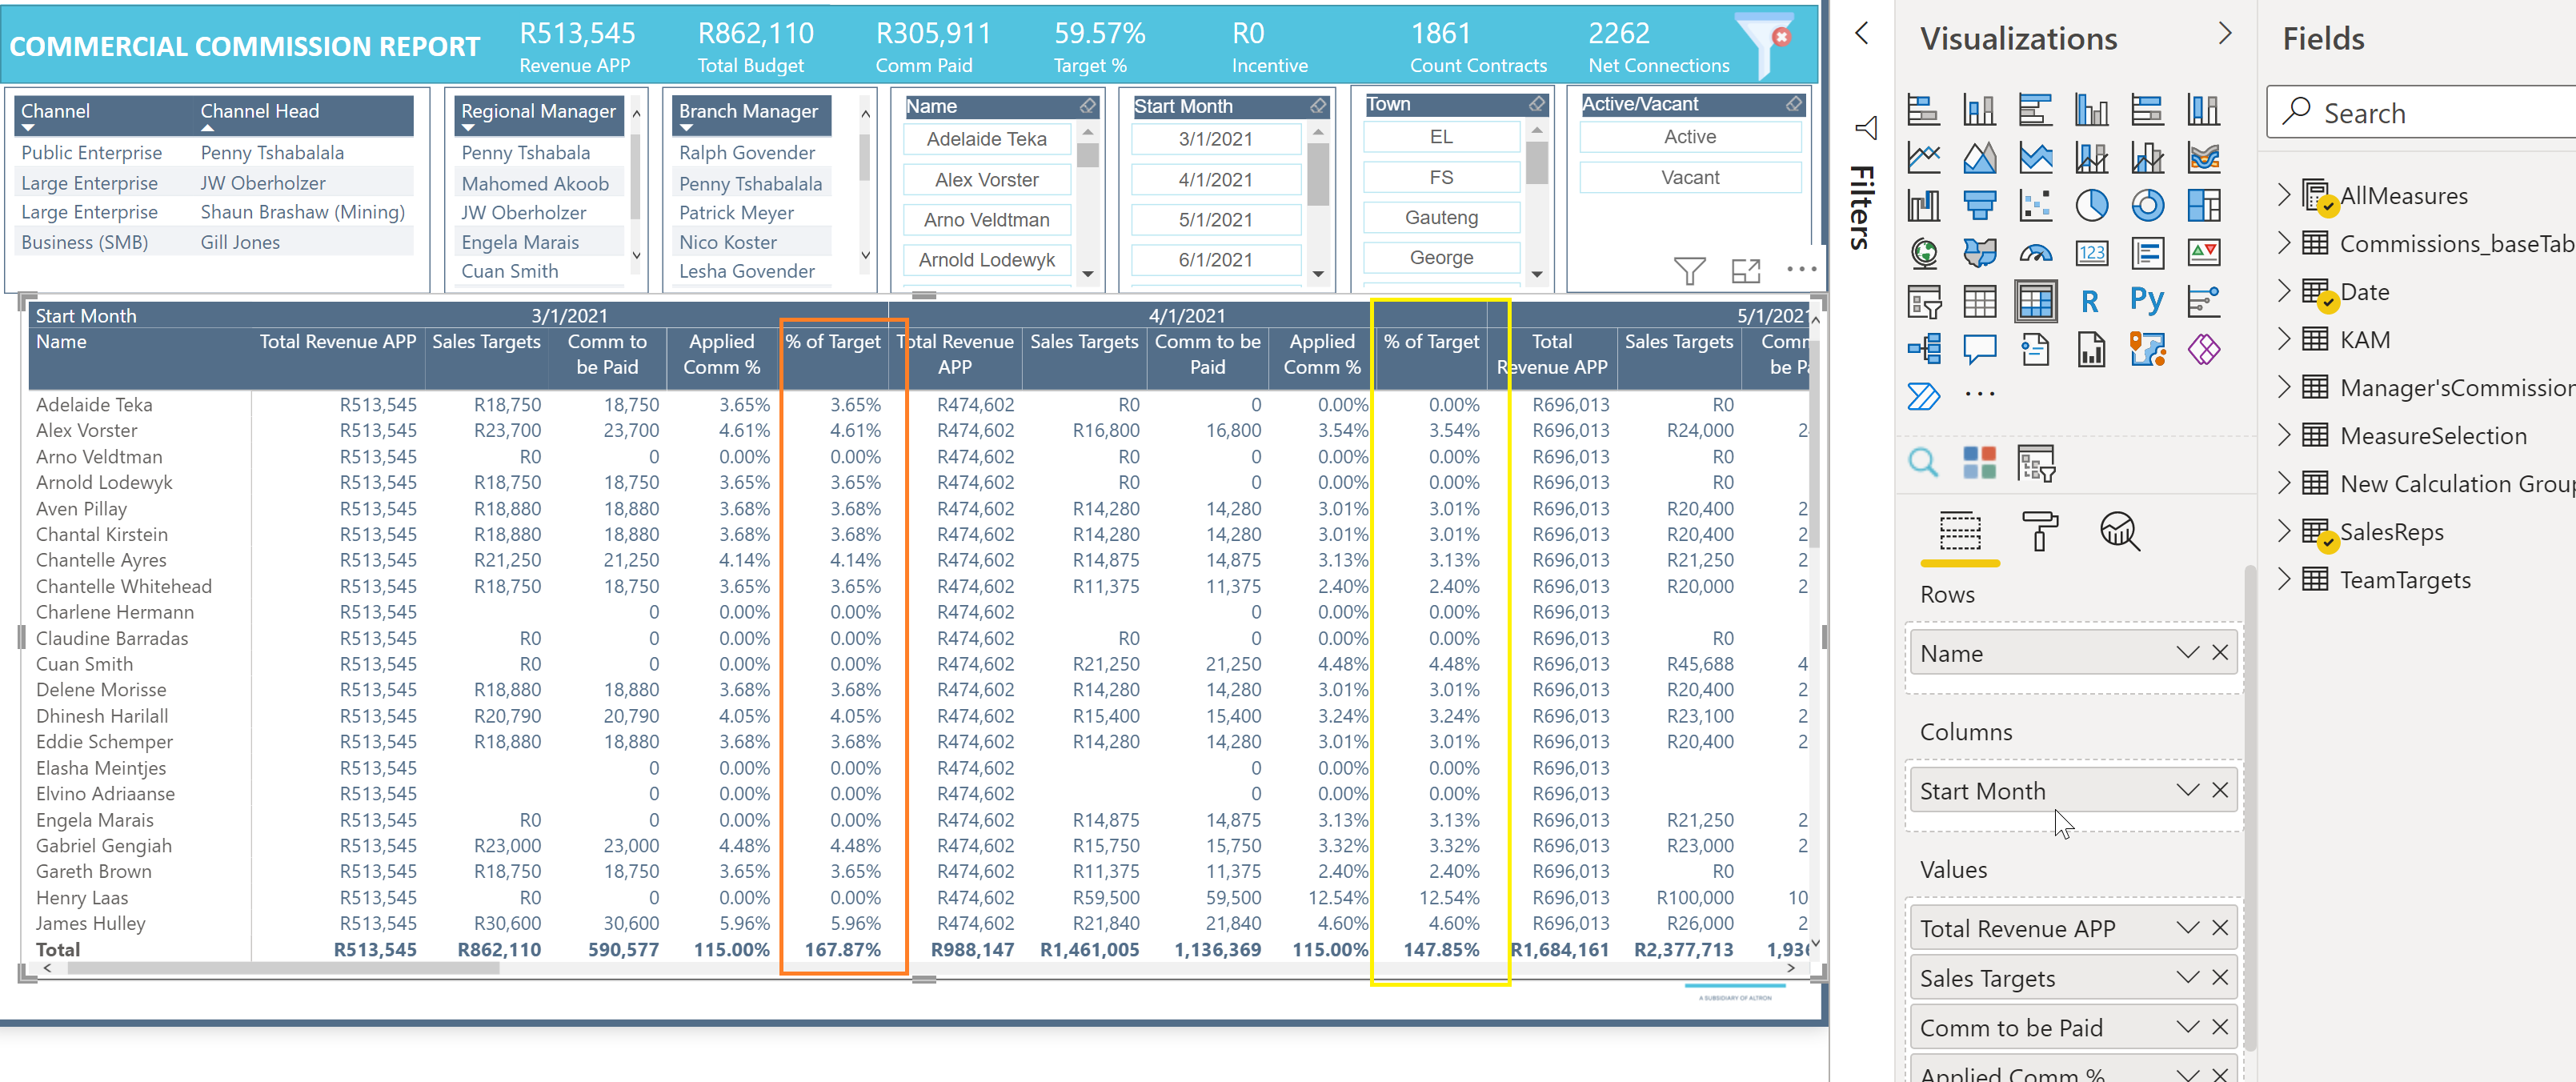
Thanks for trying to help me. Here are the files. I created a % target which removed the filters but somehow when I place the measure in the table (details) it explodes the data. I want to work out the sales person’s target, not per deal but by the entire month.
Hi @SammiP - Bit confused here, there are multiple Target measure in your file. Which measure are you referring to and in which tab you want to use it. Is it detail tab or Overview tab.
Please explain here and also what is the expected result.
Please see if the attached pbix and udpated measure helps in your requirement.
Sorry, I am not chrisp on your ask .
if it deosn’t meet your need pls let me know what is the -Expected result in some simple table illustration (Just illustration of what is happening and what value you expect may be for a subset of data)
The reason why there were multiple target measures is because I used the IsinScope Function and when I do that, when the measure is not in scope with the Month it calculates the Target as a YTD figure. I had a % of Target Achieved at the top of the report. It means I have to have multiple measures of the same thing. How I landed up using isinscope is that I wanted a Jan - Dec Columns in a Matrix with the YTD to Figure at the end of the matrix. Not in every single month.
While our users and experts do as much as reasonable to help you with your inquiries, not all concerns can be attended to especially if there are some learnings to be done. Thank you!