Hi, Everyone,
Hope you all have a great Black Friday weekend!
I am having a a bit challenge to remove filter cross tables. Attached you will see my sample file and data model, which I prefer to stay the same.
The question is to calculate the sell-through rate of a product and measure the channel performance based on sell-through rate. Here are the definition of the measures:
Units Sold = Sum of Sold units of all channels in each week
Opening Inventory = Current inventory + Units Sold
Sell-through rate = Units Sold / Opening Inventory * 100%
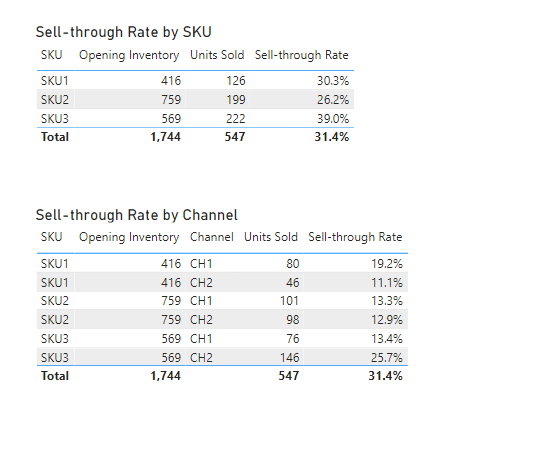
My data model and DAX work well for most of what I need shown below.

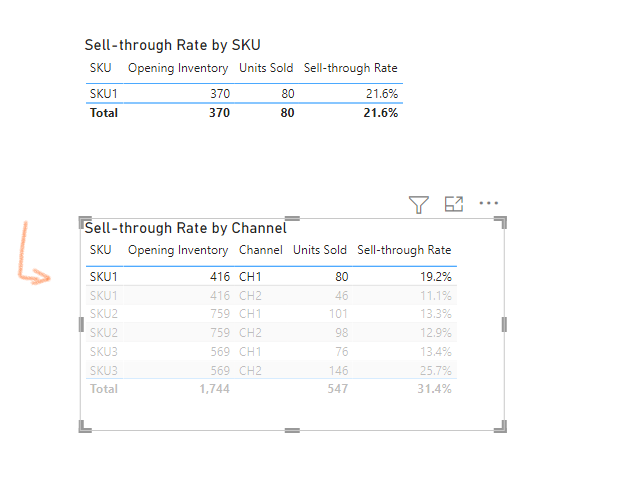
The problem is that when I interact with the visualization, I noticed the problem. When I highlighted the first row in the second table, The opening inventory for SKU1 in the first table became 370, instead of 416.

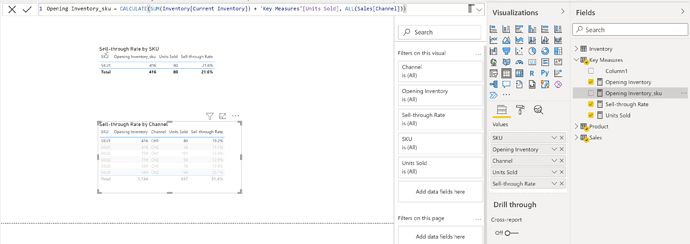
It there anyway in PowerBI to solve this problem using DAX or other method?
Thanks!
Mike
Sell-through Inventory.pbix (33.8 KB)
