Removal of row entries based on values in multiple columns

Hi,

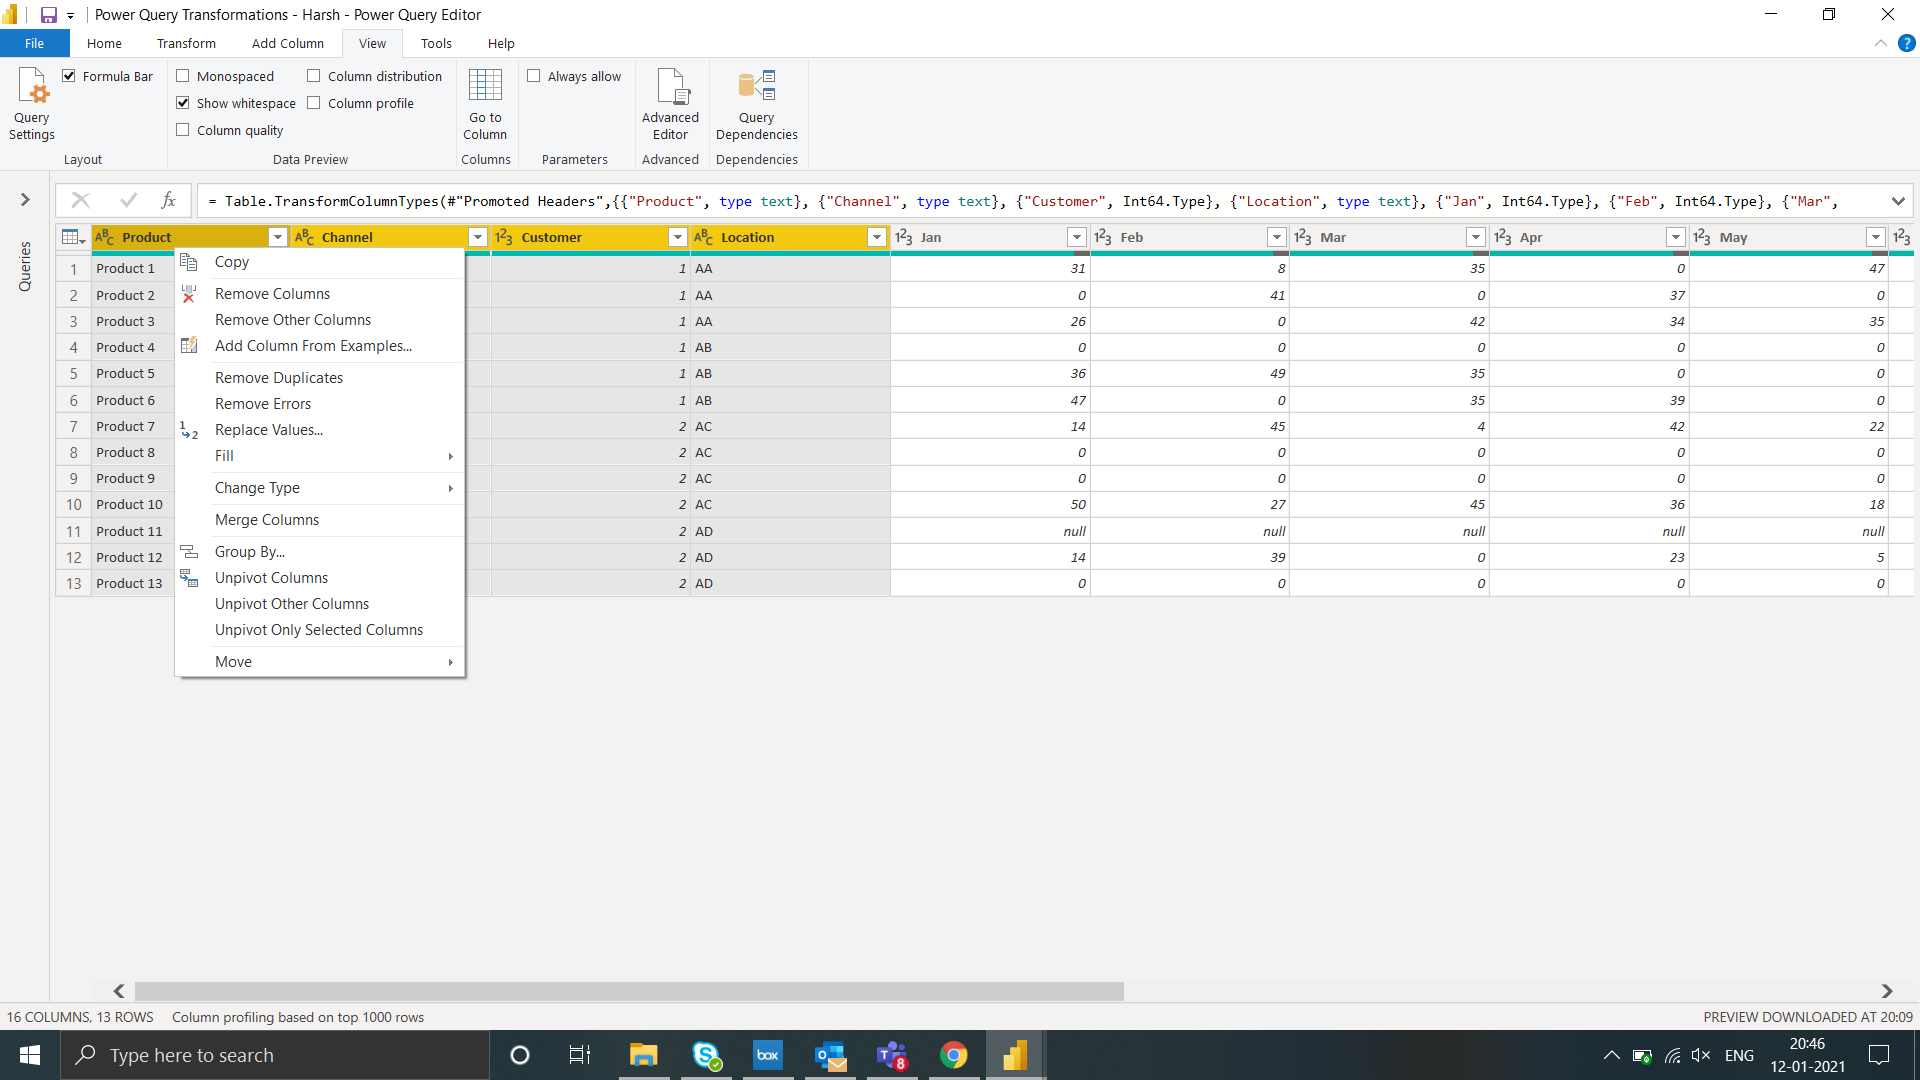
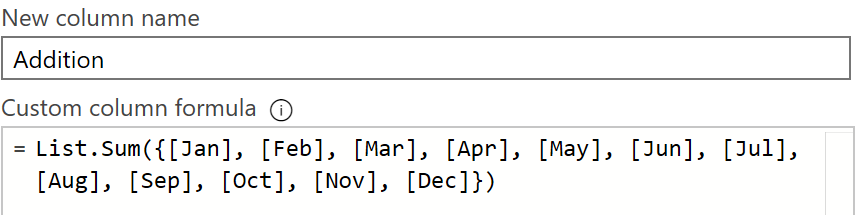
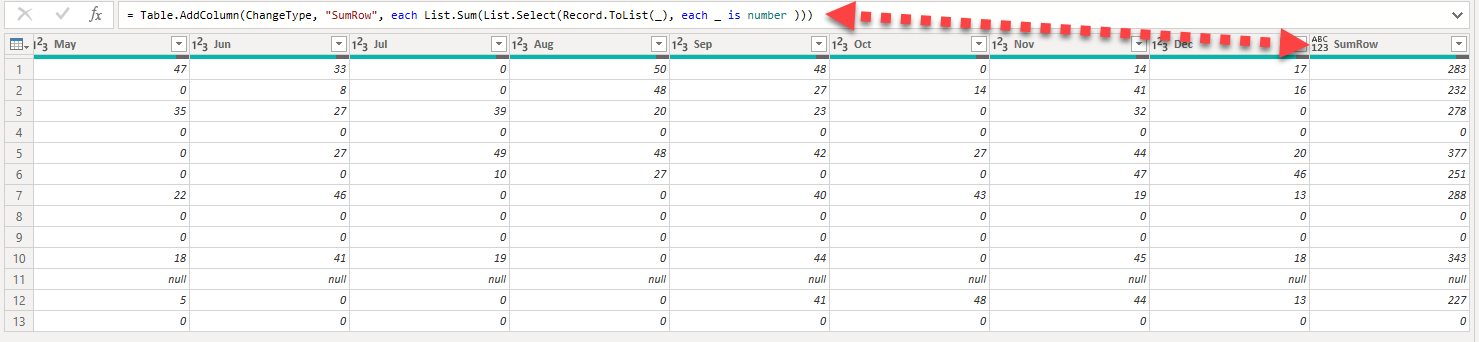
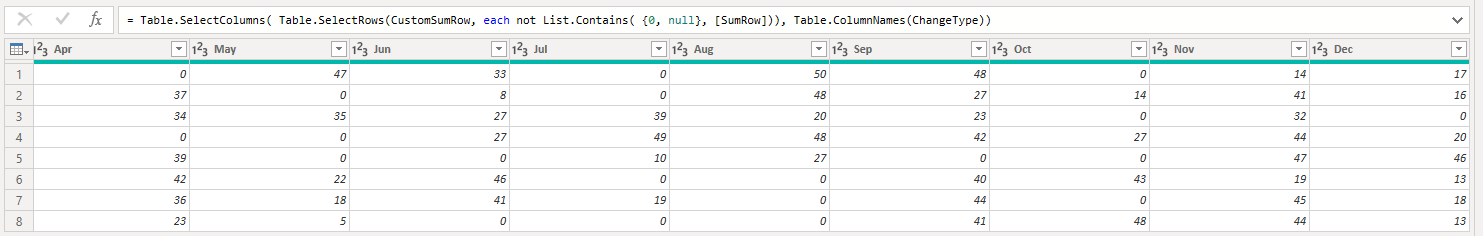
I wanted to remove rows or entries from the table based on their values in multiple columns by using power query editor. I am looking for only Power query solve and not the DAX one.
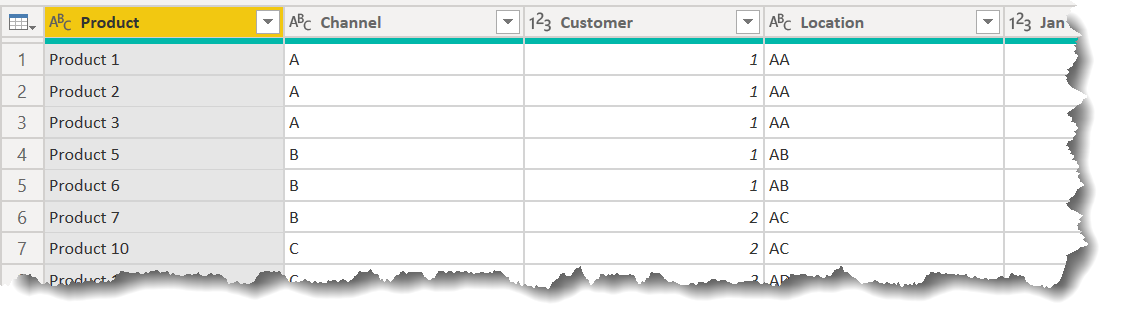
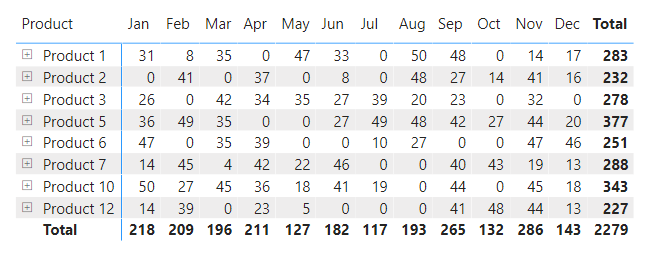
Product Channel Customer Location Jan Feb Mar Apr May Jun Jul Aug Sep Oct Nov Dec
Product 1 A 1 AA 31 8 35 0 47 33 0 50 48 0 14 17
Product 2 A 1 AA 0 41 0 37 0 8 0 48 27 14 41 16
Product 3 A 1 AA 26 0 42 34 35 27 39 20 23 0 32 0
Product 4 A 1 AB 0 0 0 0 0 0 0 0 0 0 0 0
Product 5 B 1 AB 36 49 35 0 0 27 49 48 42 27 44 20
Product 6 B 1 AB 47 0 35 39 0 0 10 27 0 0 47 46
Product 7 B 2 AC 14 45 4 42 22 46 0 0 40 43 19 13
Product 8 B 2 AC 0 0 0 0 0 0 0 0 0 0 0 0
Product 9 C 2 AC 0 0 0 0 0 0 0 0 0 0 0 0
Product 10 C 2 AC 50 27 45 36 18 41 19 0 44 0 45 18
Product 11 C 2 AD
Product 12 C 2 AD 14 39 0 23 5 0 0 0 41 48 44 13
Product 13 C 2 AD 0 0 0 0 0 0 0 0 0 0 0 0

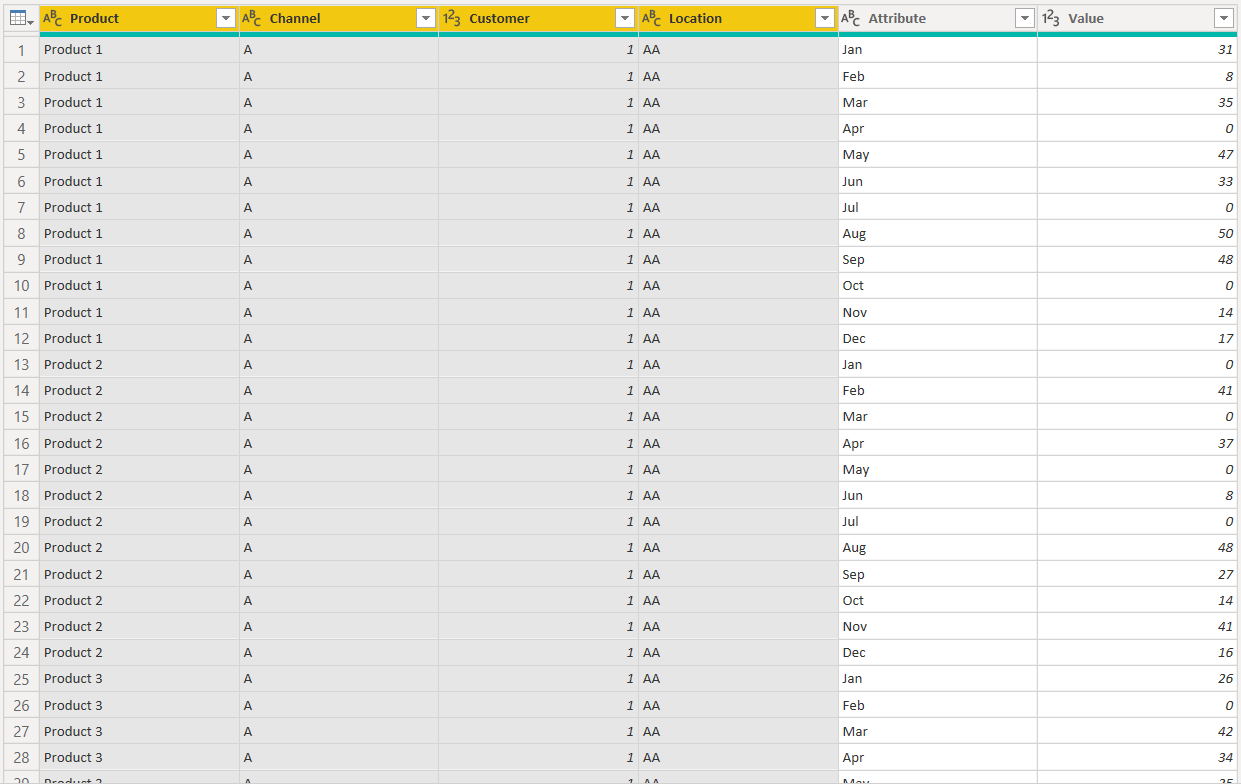
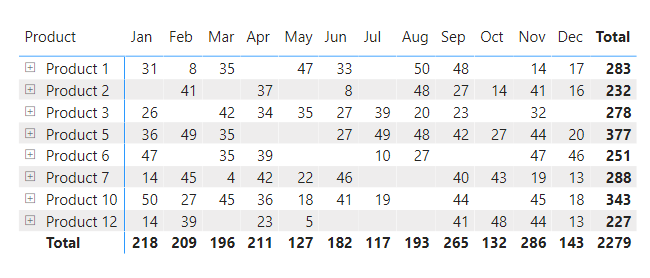
In this example, Products 4,8,9,11,13 should be removed from the entire table as they either have entire 0 values or blanks in all sales columns.

Ex.

Help is much appreciated.

Regards
James

@James_Thomas,

If your data are set up this way, this should work for you:

 let
    Source = Excel.Workbook(File.Contents(FileLocation), null, true),
    Sheet1_Sheet = Source{[Item="Sheet1",Kind="Sheet"]}[Data],
    #"Promoted Headers" = Table.PromoteHeaders(Sheet1_Sheet, [PromoteAllScalars=true]),
    #"Changed Type" = Table.TransformColumnTypes(#"Promoted Headers",{{"Product", type text}, {"Channel", type text}, {"Customer", Int64.Type}, {"Location", type text}, {"Jan", Int64.Type}, {"Feb", Int64.Type}, {"Mar", Int64.Type}, {"Apr", Int64.Type}, {"May", Int64.Type}, {"Jun", Int64.Type}, {"Jul", Int64.Type}, {"Aug", Int64.Type}, {"Sep", Int64.Type}, {"Oct", Int64.Type}, {"Nov", Int64.Type}, {"Dec", Int64.Type}}),
    #"Inserted Sum" = Table.AddColumn(#"Changed Type", "Addition", each List.Sum({[Jan], [Feb], [Mar], [Apr], [May], [Jun], [Jul], [Aug], [Sep], [Oct], [Nov], [Dec]}), Int64.Type),
    #"Renamed Columns" = Table.RenameColumns(#"Inserted Sum",{{"Addition", "Sum"}}),
    #"Filtered Rows" = Table.SelectRows(#"Renamed Columns", each ([Sum] <> null and [Sum] <> 0))
in
    #"Filtered Rows"

Just point the FileLocation parameter to your data file.

I hope this is helpful. Full solution file attached.

  • Brian

P.S. The structure you provided in the example table, with a separate column for each month is definitely not ideal for Power BI. Instead, this should just be two columns - one for date (linked to a validated Dates table) and one for Sales.

eDNA Forum - Filtering Null and Blank Rows Solution.pbix (30.4 KB)
Test Data.xlsx (9.5 KB)

2 Likes

Hello @James_Thomas,

Thank You for posting your query onto the Forum.

Below are the steps provided alongwith the screenshots for the reference -

Step 1: Load the Entire Data Into The Power Query.

Step 2: Select the columns from Product till Location then right-click on any of the selected columns and than select the “Unpivot Other Columns” option.

By this way, the blanks/null rows will be removed by default/automatically.

Step 3: Filter Out The Values = 0.

Step 4: Click On “Close & Apply” Button.

Step 5: Now there are two options to represent the visualizations in Matrix.

Option 1: Simply Drag and Drop the fields and Values into the Matrix

Option 1 - Results

Now, if you observe when we filtered out the values that were equal to 0. In that case, the products which had mixed combination of values i.e. values = 0 and values > 0 are left with the values only more than 0 and remaining shows it as “BLANKS”.

So now, if you don’t want to show the “BLANKS” against the products that have values than let’s check out the option 2.

Option 2: Create a small Measure to replace the BLANKS with the 0’s.

Total Sales = 
VAR TotalSales = SUM( Sales[Sales] )

RETURN
IF( ISBLANK( TotalSales ) , 
    0 , 
        TotalSales )

Option 2 - Results

I’m also attaching the working of the Excel as well as PBIX file for the reference.

Hoping you find this useful and meets your requirements that you’ve been looking for. :slightly_smiling_face:

Thanks and Warm Regards,
Harsh

Raw Data - Harsh.xlsx (11.0 KB)

Power Query Transformations - Harsh.pbix (37.1 KB)

2 Likes

@BrianJ,

Thanks for prompt response. Impressed the way you approached this problem. This solves 50% of my problem.

I am looking for dynamic solution which encounters below cases,

  1. Assume I have many sales columns (i.e, more than 36 columns) (could be in dates or months)

Is it advisable to type all column headers in this formula? Is there any way I could do sum by referencing all column values instead column headers?

  1. These Column headers would change as we progress into future but total number of columns remain same. I.e, rolling column count of 36

End of all, I am looking for an table/excel output which removes row entries which have 0 or blanks values in entire columns.

Thanks in advance :blush:

@Harsh, Thanks for your approach combination of Power Query and DAX which I am following already. I am looking for only power query solve.

Regards
James

@James_Thomas,

Your questions are all good ones, and speak directly to the point I raised in my P.S. - the data in your fact table needs to be structured differently (long and thin - lots of rows, few columns) rather than the “short and wide” approach in your example. Under this structure, the questions/concerns you correctly cite will disappear, and the solution will be far more flexible/dynamic.

If you can please provide your PBIX file and the underlying data file, I can show you specifically how this would work.

If your data are sensitive, I’ve put together the following video that walks through some simple techniques for masking confidential data so that you can post your file on the forum.

Thanks.

  • Brian

Hi @James_Thomas,

Here’s a variation to the approach taken by @BrianJ, please know that there is one important prerequisite and that’s that there shouldn’t be any other Type number columns in your table - so the Customer column for example needs to be a Type text.

Paste the code below in a new blank query.

let
    Source = Table.FromRows(Json.Document(Binary.Decompress(Binary.FromText("rZO7DsIwDEV/BXVmqGO3KSOPD2BHTLAjIfh/4ts4OGHgIaQmdVL7xLl2D4duf72c76fbgrplt04DbzVYrUmNIU19GhJ1xXk1YGvKKxKdYndcPpGhRSKCssExG4YAK0SDwZHGisgtMYwWrIexWLrA8Eot/RosaQ4wPFM8c5P9Ph8epSdvPIo1PVl5EXvLDtu4M3Kf92TO2EPHFiomHJi4pIGp0G0HzlKrGDMR9dkWvZUmJZ0wxzkSJhWS9Ejiijm1zN9VVPr2PyjoUbGGp/6DFYim0m4mJgrRm1dyqKjkqbs0vX+q+NDGowClkuhW3y/lv5nbRV7lJ26RX4p2fAA=", BinaryEncoding.Base64), Compression.Deflate)), let _t = ((type nullable text) meta [Serialized.Text = true]) in type table [Product = _t, Channel = _t, Customer = _t, Location = _t, Jan = _t, Feb = _t, Mar = _t, Apr = _t, May = _t, Jun = _t, Jul = _t, Aug = _t, Sep = _t, Oct = _t, Nov = _t, Dec = _t]),
    ChangeType = Table.TransformColumnTypes(Source,{{"Product", type text}, {"Channel", type text}, {"Customer", type text}, {"Location", type text}, {"Jan", Int64.Type}, {"Feb", Int64.Type}, {"Mar", Int64.Type}, {"Apr", Int64.Type}, {"May", Int64.Type}, {"Jun", Int64.Type}, {"Jul", Int64.Type}, {"Aug", Int64.Type}, {"Sep", Int64.Type}, {"Oct", Int64.Type}, {"Nov", Int64.Type}, {"Dec", Int64.Type}}),
    CustomSumRow = Table.AddColumn(ChangeType, "SumRow", each List.Sum(List.Select(Record.ToList(_), each _ is number ))),
    FilterRows = Table.SelectColumns( Table.SelectRows(CustomSumRow, each not List.Contains( {0, null}, [SumRow])), Table.ColumnNames(ChangeType))
in
    FilterRows

.
Here you don’t require the column names to sum all numeric values in the row (record).

And finally filter rows and remove the helper column

I hope this is helpful.

1 Like

Hi @James_Thomas, did the response provided by the users and experts helped you solve your query? If not, how far did you get and what kind of help you need further? If yes, kindly mark the thread as solved. Thanks!

Hi @James_Thomas, we’ve noticed that no response has been received from you since the 13th of January. We just want to check if you still need further help with this post? In case there won’t be any activity on it in the next few days, we’ll be tagging this post as Solved. If you have a follow question or concern related to this topic, please remove the Solution tag first by clicking the three dots beside Reply and then untick the checkbox. Thanks!

A response on this post has been tagged as “Solution”. If you have a follow question or concern related to this topic, please remove the Solution tag first by clicking the three dots beside Reply and then untick the check box. Thanks!