Refresh data error when the original file source gets updated

Hi All,

I have a couple of files imported where every time a new updated file is generated it replaces the existing one. The new file(s) that replace the old ones always removes the previous month’s data.

As a result i get the message below:
image

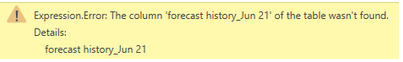
So in my visualisation i have a historical view of sales, orders and so on (sometimes previously 3 months back) and every new month i need it to replace it with the column that has replaced the old column.

How do i get my visualisation to display what the new raw file displays every time i refresh. For example using the screenshot above ‘forecast history_Jun 21’ does not exist in the new file and it will show ‘forecast history_Jul 21’ instead as the new raw file will only display the forecast history 3 months back

Thank you !

Hi @joseph.chang,

Somewhere you are passing a hard coded list with column names (so, text strings). Replace that with ‘new column names’ using the Table.ColumnNames function to retrieve them.

If you need more help, please provide a small sample.
All the best

Planning Sheet 61…pbix (31.2 MB)

Hi Melissa, would you be able to provide a snapshot of the process on how to fix this? (apologies, im very new to power bi, I’ve uploaded my pbix file). Below is an example of the file that gets generated everyday. So for example you can see forecast history_Sep 21, forecast history_Oct 21 and forecast history_Nov 21. The next month will be January 2022 so forecast history_Sep 21 will disappear and it will be Oct, Nov and Dec.

So how would i be able to get power bi (query) to automatically detect this (when i refresh it) so it reflects the newest data every day or month even when the column names change (from the original data source).

Thank you again Melissa !

Hi @joseph.chang ,

As as @Melissa suggested you can use Table.ColumnNames to get the names of columns and then use this to transform your data, based on you pbix file you need to add 2 steps to change the type of columns like below for the “Sales Forecast” table, you can replicate same for others too.

I have used 19 to get the exact number of columns with dynamic header.

let
    Source = Csv.Document(File.Contents("\\corp\data\EI_Transfer\Supply Chain\IBP\Netstock\sales_forecast_total_SA.csv"),[Delimiter=",", Columns=41, Encoding=1252, QuoteStyle=QuoteStyle.None]),
    #"Promoted Headers" = Table.PromoteHeaders(Source, [PromoteAllScalars=true]),
    Headers = List.LastN( Table.ColumnNames( #"Promoted Headers" ), 19 ),
    #"Changed Type" =  Table.TransformColumnTypes(#"Promoted Headers",{{" supplier_code", type text}, {"article_number", type text}, {"item", type text}, {"description", type text}, {"group", type text}, {"category", type text}, {"class", type text}, {"ABC Ind", type text}, {"brand", type text}, {"supply chain ind", type text}, {"classification", type text}, {"stock on hand", Int64.Type}, {"allocated_stock", Int64.Type}, {"on_order", Int64.Type}, {"available_stock", Int64.Type}, {"customer orders", Int64.Type}, {"age", Int64.Type}, {"ranged_cnt", Int64.Type}, {"predecessor", type text}, {"average cost", type number}, {"LT Qty", Int64.Type}, {"SS Qty", Int64.Type}}),
    Custom1 = Table.TransformColumnTypes(#"Changed Type",List.Transform(Headers, each { _ , Int64.Type}))
in
    Custom1
2 Likes

Hello @joseph.chang, we noticed no response from you since December 7th.

Did the responses above help you with your inquiry?

Hi @joseph.chang, due to inactivity, a response on this post has been tagged as “Solution”. If you have any concern related to this topic, you can create a new thread.