EDNA Solution - Rank 5 above and 5 below-tjohnson working solution-average population.pbix (9.1 MB)
Hi–I have been developing a power bi file to show how different cities relate as to their population size–I have attached my pbix sample file.
With considerable assistance from this forum from @ankit and @jbressan, I have progressed to this point. The page showing Tjohnson working solution is showing how the visual is at this point–where you select a City, then the 5 cities in population larger than that city and the 5 cities in population below that city are shown, along with the selected city. This is all working–also shown is the Population Rank of each city within the state for the fiscal year selected, the population, total taxes, etc.
What is now the problem is that I have a table called tblCityPopulationByYear–this has a user relationship to the date table since my CitySalesTaxCollections has a direct connection to the date table. For each city, I have taken the census figure and entered the census amount for each month for the year. However, when you are calculating by Fiscal Year–if the census has changed, the amounts change from 1 year to the other. See examples below for City 101
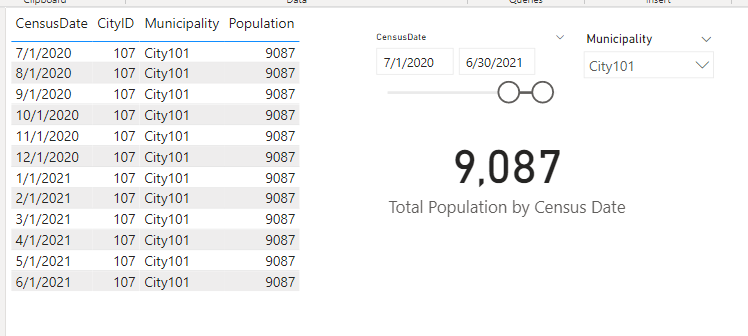
In this case–the monthly population amounts for months 7/1/2020-6/30/2021 do not change, therefore the average population is the same as the population for each month. When this is the case, the chart works correctly as shown below.
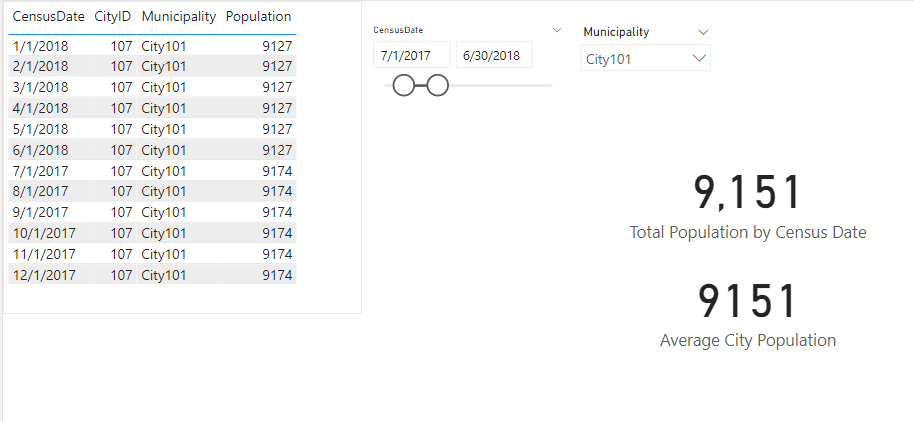
However, on the fiscal years where the census has change, it is not working correctly. See below for City 101 for Fiscal Year for months 7/1/2017-6/30/2018
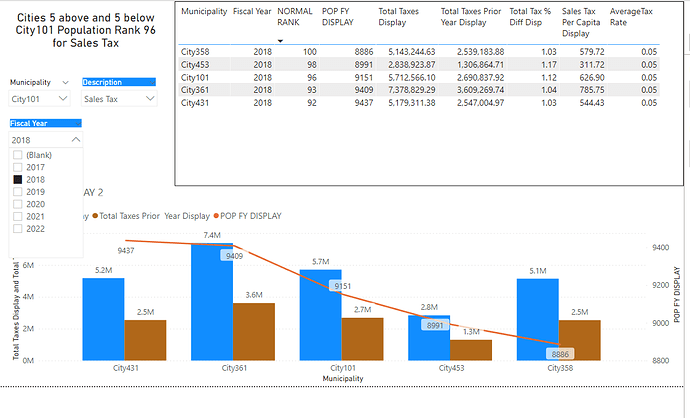
On this page–the average population is calculating correctly. However, when placed on the chart for 5 up and 5 down, this is what happens.
As you can see, the rank doubles, also only 5 are displaying since the difference between the ranks have changed.
The measures that are calculating the rank are as follows.
NORMALRANK = CALCULATE([Census Pop Rank FY Display],ALL(tbl1City))
This is branching from this measure
    Census Pop Rank FY Display =
    RANKX( ALL(tblCityPopulationByYear),[POP FY DISPLAY],,DESC,Dense)
The measures for the population for the chart is as follows:
POP FY DISPLAY = CALCULATE([Pop FY],ALL(tbl1City))
This is branching from this measure
Pop FY = VAR FYPopAvg = AVERAGEX( VALUES( dDate[Fiscal Year] ), [Total Population by Census Date] )
VAR PopAverageTotal = SUMMARIZE (dDate, dDate[Fiscal Year], "FY Pop Avg", FYPopAvg )

RETURN
IF( HASONEVALUE( dDate[Fiscal Year] ),
    FYPopAvg,
        SUMX( PopAverageTotal, [FY Pop Avg] ))
Which is using this measure to calculate the average population.
Total Population by Census Date = CALCULATE([Average City Population],USERELATIONSHIP(tblCityPopulationByYear[CensusDate],dDate[Date]))
I have included screens for 2 cities within the chart for population for different fiscal years so you can see the amounts entered for each month.
I am fairly new to Power Bi and I am not a programmer. I have searched extensively for this issue. The rank works correctly if it is not comparing the 5 up and 5 down, so I know it has something to do with that visual. If anyone can please give assistance or point me in the right direction, I would appreciate it. I have modified the formula several times for the visual rank formula, but have not found the appropriate solution.
Thank you all in advance!
#dax-formula, #


