Hi,
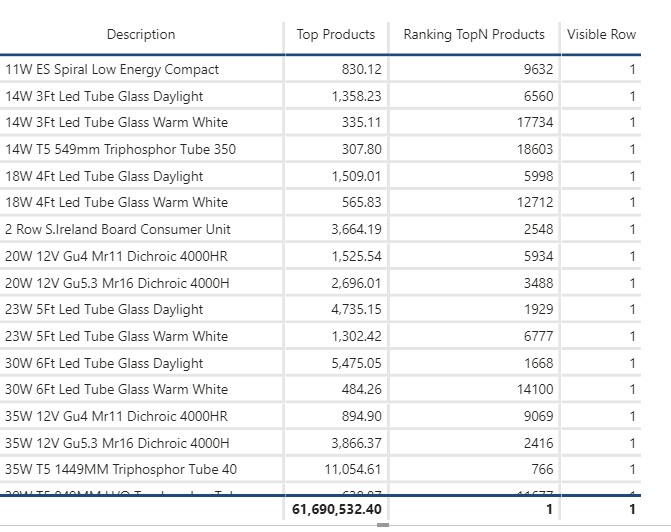
I have put together a Product Ranking Matrix and want to show the Total from the Column Matrix for Top Products on a Card but I am getting a slightly different number and cannot figure out why so hopefully one of the kind EDNA soouls can help.
Thanks
Chris
Measures
This Ranks the Top Products with the amount of products to be Ranked selected on a Slicer that sets TopN Value
Ranking TopN Products =
VAR ProductsToRank = [TopN Value]
VAR SalesAmount = [Sales (PI)]
VAR Ranking =
RANKX (ALLSELECTED ( Products[Description] ), SalesAmount)
RETURN
IF ( Ranking > 0 && Ranking <= ProductsToRank, Ranking )
This Calculates a 1 or a 0 which is used to hide the o’s which are products where the Ranking is greater than the MAX on the Slider
Visible Row =
VAR Ranking = [Ranking TopN Products]
VAR TopNValue = [TopN Value]
VAR Result =
IF (
NOT ISBLANK ( Ranking ),
( Ranking <= TopNValue ) - ( Ranking = TopNValue + 1 )
)
RETURN
Result
This is the Total Products Measure which is shown on teh Card and the Matrix below.
Top Products =
SUMX(VALUES(Products[Description]),

IF( [Ranking TopN Products] <= 'TopN'[TopN Value] && [Visible Row] > 0, [Sales (PI)]))
Note the Top Products Total
This is the same measure on a Card

As you can see the difference is around £1280 with 28000 products being Ranked.
Hope this makes sense, any help is appreciated as it has to be something daft.

