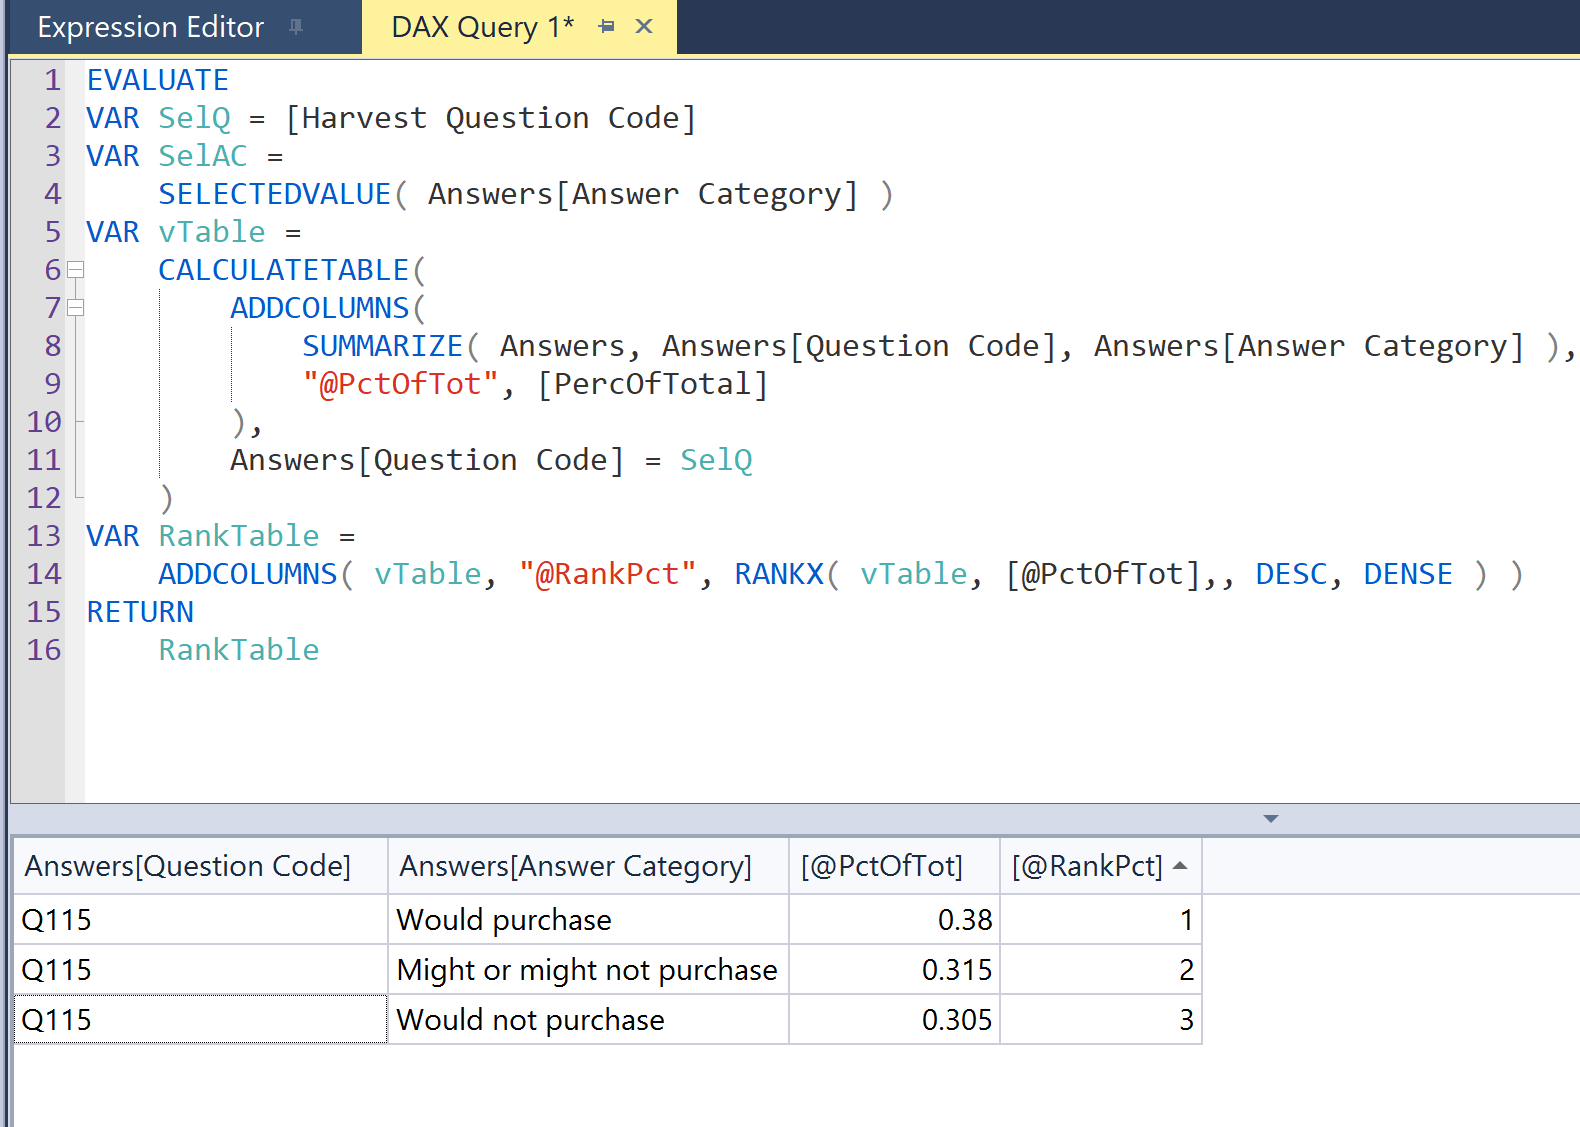
I want to be able to reference the ranking in a virtual table in a data story/explanation (e.g. "Of the respondents in this group, the most common response is " {Answer Category with the highest rank}, making {percentage with the highest rank} of the responses.
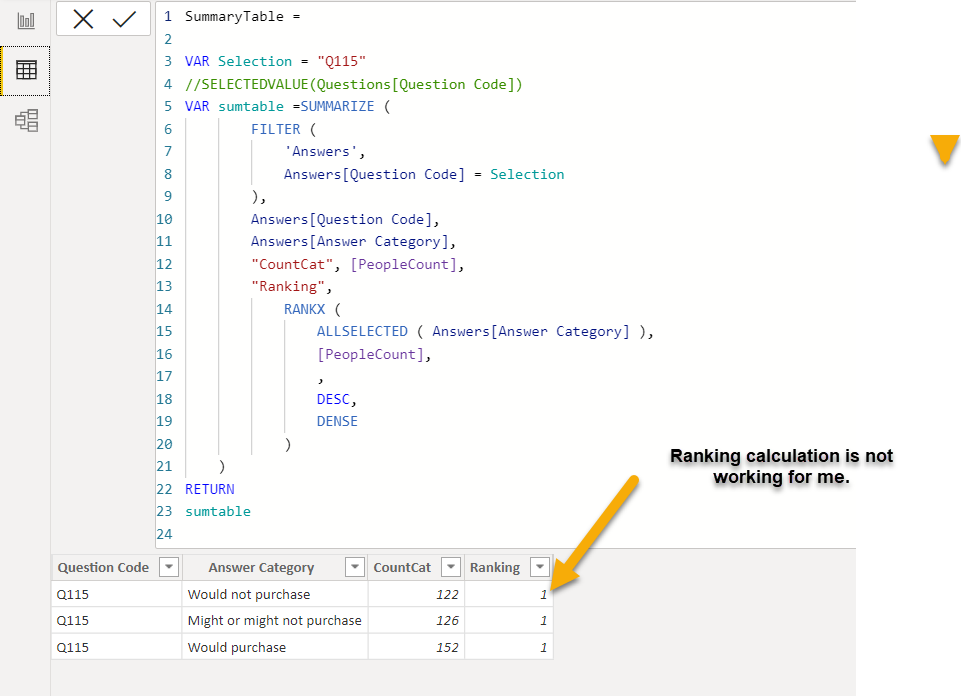
I tried to create a temporary virtual table selecting only one question (see screenshot) but I’m getting a rank of 1 for all answer categories. I know this is a common problem and I’ve watched lots of videos, but I don’t seem to be able to solve it.
This is a tough nut to crack. The problem with the approach you’re taking is that it’s not a virtual table - it’s a DAX calculated table, which only recalculates on manual refresh or when you first open the report. This will work the first time, but then when you change the value for the slicer, the table will remain static.
What you’re going to need to do here is build the ranking table as a true virtual table within a measure, and extract the proper value from that table for each cell of your table visual.
I’m working on this now. Confirmed in TE3 that the virtual table is calculating properly, but now need to get the proper value extracted, which is giving me some trouble. Hopefully, should have a solution for you later today.
I’m sorry I misled you with the examples. I really want to have a virtual table from which to draw the rankings but I tried to create an actual table just to work through it. That’s what you saw. I really appreciate your taking this on as I’ve been working a few days on it!
OK, making progress. I’ve written and rewritten my DAX code six ways to Sunday and what should work isn’t working. Which almost always means there’s an issue in the data model, which I believe is the case here. Let me do some reworking on that, and I believe I’ll have a solution for you later tonight.
Usually, the final step of pulling the proper value of [@RankPct] out of the table variable returning that in context as a scalar in the visual is very straightforward. However, I’m unexpectedly finding it incredibly difficult due to the structure of your data model. How open would you be to me restructuring your model to make it star schema compliant (basically merging Answers and NewLongTable, filtetered by Questions)?
I believe this will make the final step of this solution much easier, plus be more straightforward in general for other DAX measures.
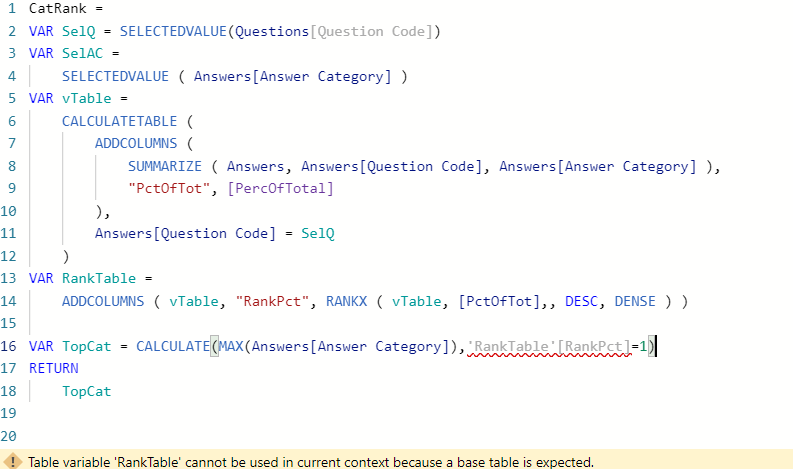
Well, I need to see the data model. Is it included somewhere that I’m missing? I’ve tried using the Dax query in my current data model and it produces a table…but I haven’t been able to draw info from that table. When I add a variable to choose the category with the top ranking, it does not like that because I’m not referring to a “base table”
Sorry if my previous post was confusing. It wasn’t intended to be even a partial solution - just wanted to show you I was making progress and confirm that doing some revision to the data model would be OK (because in some cases, the original poster does not control the data model, so we have to work with it as given, but that doesn’t sound like the case here). WIll continue working this one and keep you posted.
Haven’t forgotten about you - just had a couple of priority projects for Sam pop up. Have some dedicated time tomorrow blocked out for this to hopefully wrap it up. Thanks for your patience!