Ranking members within group

Hi all,

Hoping someone can help me with my RANKX Dax. Sam has many great videos on Ranking, but I just seem to be going around in circles with this one!

Please see attached mock up, where I have tried to simplify my and demonstrate my problem.

We have 2 Brands, Asda and Tesco. Within each one, there are Sites, such as Asda Basingstoke. And within each Site there are Sales Persons, such as John.

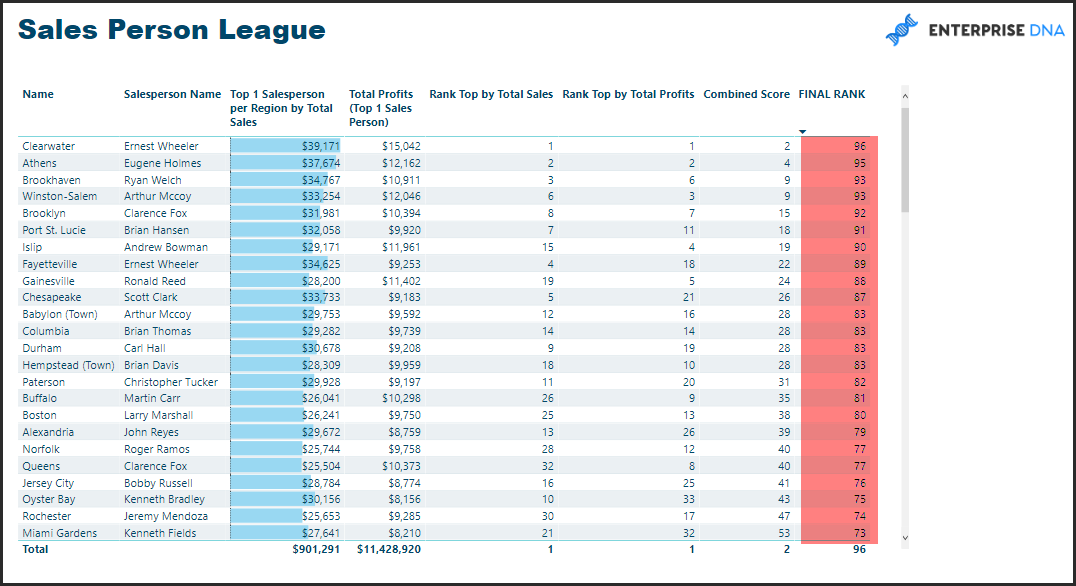
My ultimate goal is to return a table showing the top 1 Sales Persons per site, along with their rank within their Brand and their rank among all of the top sales people.

I have started with measures, Percentage of Sales in Site / Brand / All, which compare the Sales Persons individual sales, with that of all sales in the site, brand or all:

Percentage of Sales in Site =
var __SalesBySite = CALCULATE([No Of Sales], ALL(Sales[Sales Person]))
RETURN
DIVIDE([No Of Sales], __SalesBySite, 0)

.

Pct of Sales in Brand =
var __SalesByBrand = CALCULATE([No Of Sales], ALL(Sales[Sales Person]), ALL(Sales[Site]))
RETURN
DIVIDE([No Of Sales], __SalesByBrand, 0)

.

Pct of Sales in ALL =
var __SalesByAll = CALCULATE([No Of Sales], ALL(Sales[Sales Person]), ALL(Sales[Site]), ALL(Sales[Brand]))
RETURN
DIVIDE([No Of Sales], __SalesByAll, 0)

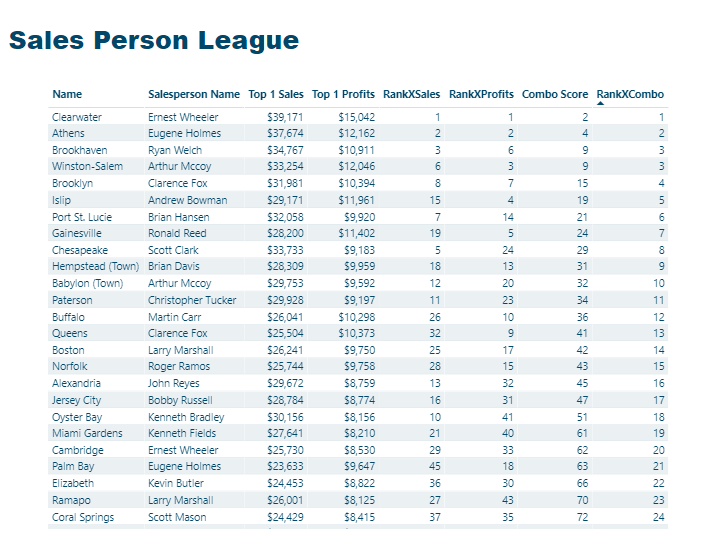
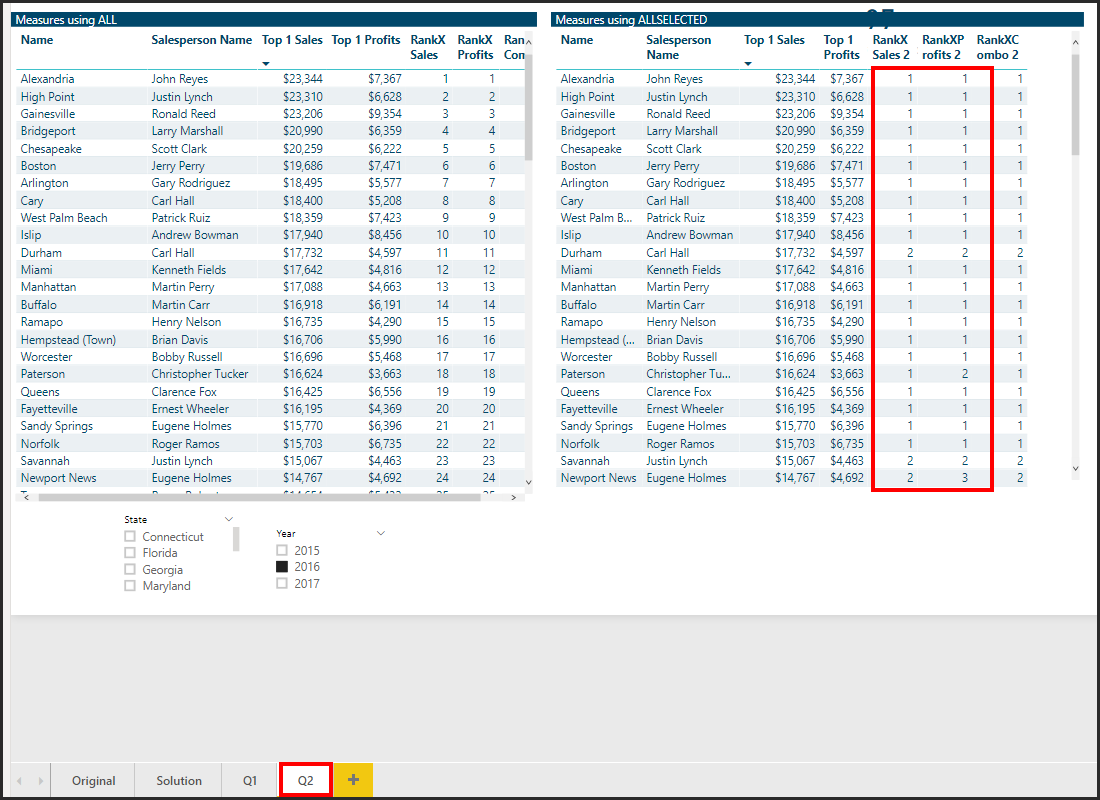
I have then created ranking measure over each, eg ‘Rank within Site’, which correctly ranks the Sales Persons within their site, based on their percentage of sales.

Rank within Site = 
RANKX(ALL(Sales[Sales Person]), [Percentage of Sales in Site], , DESC)

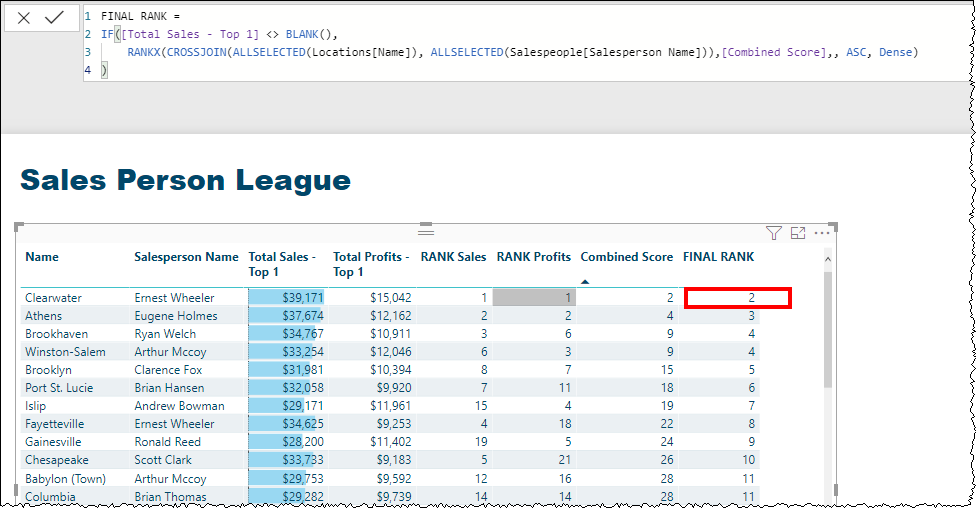
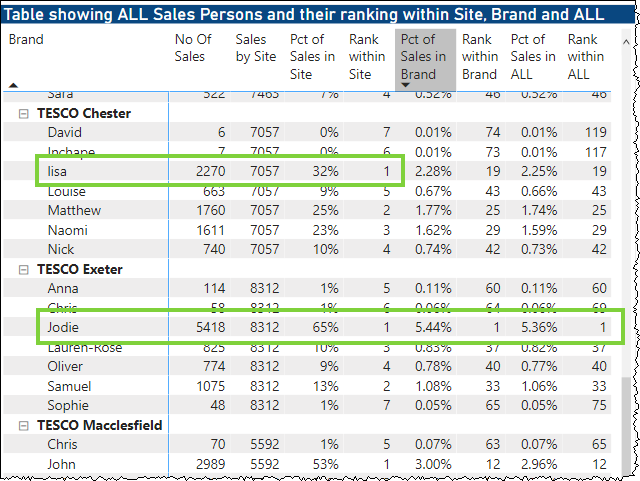
This gives me my first table with all looking ok. Lisa is the top sales person at Tesco Chester, whereas Jodie is the top sale person across all 3 measures:

image

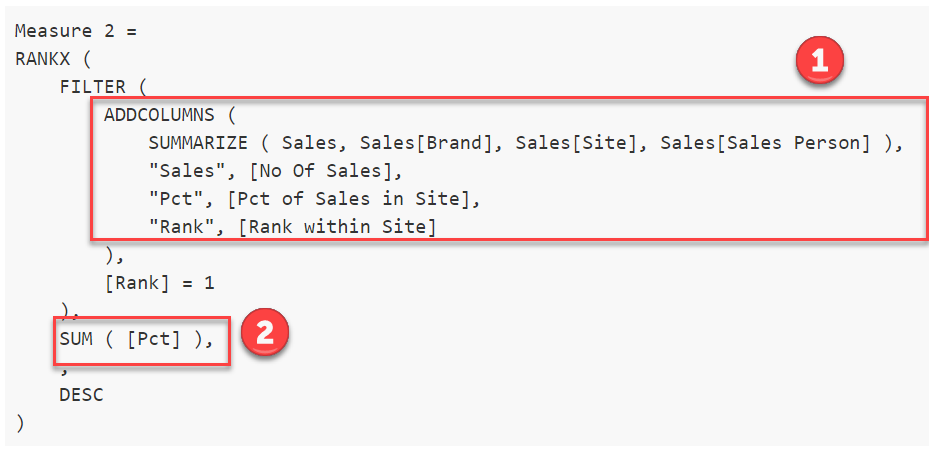
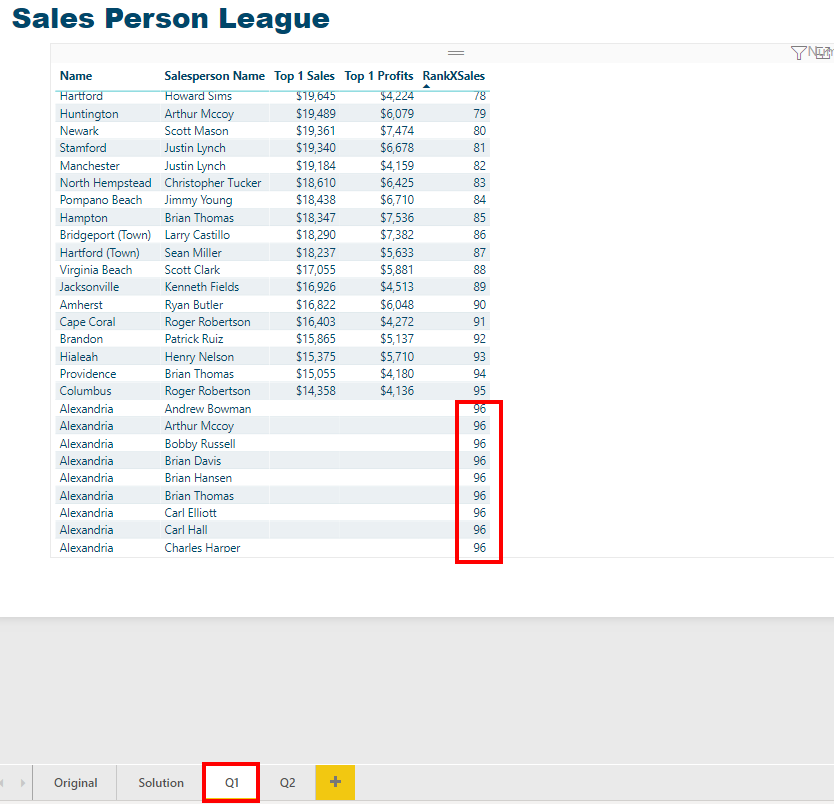
I then want to create my final table, just returning the top sales persons from each site. I have initially done this by filtering the Matrix, where Rank within Site = 1. However I am sure there is a better way to do this using DAX and TOPN?

But the result is not quite as desired:

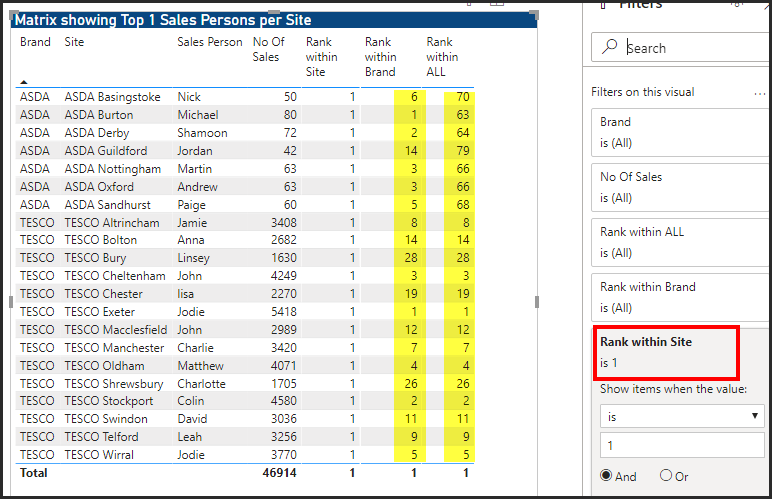
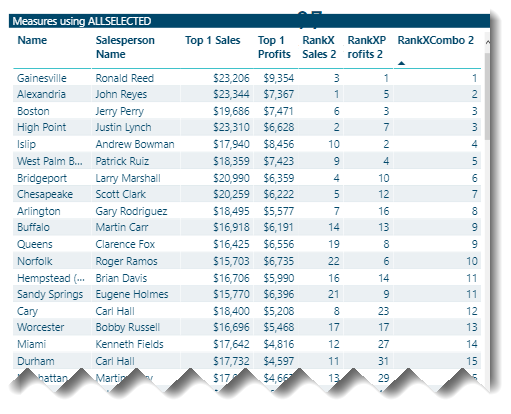
My ranks within Brand and within ALL are still based on all Sales Persons, whereas I want this to matrix to only consider the Top 21 Sales Persons, so no rank value should be greater than 21.

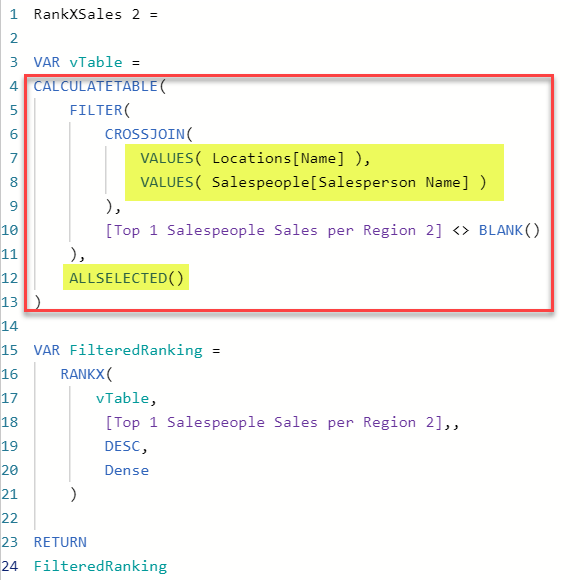
I think I therefore need to modify by Rank withon Brand and All measures, so that they calculate over this summarised dataset and not over all, I am just struggling with this concept!

Hopefully the above is relatively clear, any help appreciated as always!

Thanks

Mark

Hi @Mark, we aim to consistently improve the topics being posted on the forum to help you in getting a strong solution faster. While waiting for a response, here are some tips so you can get the most out of the forum and other Enterprise DNA resources.

  • Use the forum search to discover if your query has been asked before by another member.

  • When posting a topic with formula make sure that it is correctly formatted to preformated text </>.

  • Use the proper category that best describes your topic

  • Provide as much context to a question as possible.

  • Include demo pbix file, images of the entire scenario you are dealing with, screenshot of the data model, details of how you want to visualize a result, and any other supporting links and details.

I also suggest that you check the forum guideline https://forum.enterprisedna.co/t/how-to-use-the-enterprise-dna-support-forum/3951. Not adhering to it may sometimes cause delay in getting an answer.

Well I have spent all afternoon re-watching the Enterprise DNA Mastering Dax course videos, in particular the Advanced Table Functions section.

Using Sam’s suggestion on how to understand Table functions, I have created a DAX table, which filters my Sales Persons to those who are ranked No 1 Within their Site:

Top 1 Sales People =
FILTER (
    ADDCOLUMNS (
        SUMMARIZE ( Sales, Sales[Brand], Sales[Site], Sales[Sales Person] ),
        "Sales", [No Of Sales],
        "Pct", [Pct of Sales in Site],
        "Rank", [Rank within Site]
    ),
    [Rank] = 1
)

This has then allowed me to create a table, with my Rank within Group and Rank within ALL showing the desired numbers:

However, this is just a static table and in my real world report would not work, as it would not be filtered by other dimensions such as date etc.

So, I was hoping to then incorporate my table function into a dynamic measure, allowing me to rank the 21 rows Top Sales Person per site, giving me my Rank within Group and Rank within ALL. However, I can’t get this to work?

Measure 2 =
RANKX (
    FILTER (
        ADDCOLUMNS (
            SUMMARIZE ( Sales, Sales[Brand], Sales[Site], Sales[Sales Person] ),
            "Sales", [No Of Sales],
            "Pct", [Pct of Sales in Site],
            "Rank", [Rank within Site]
        ),
        [Rank] = 1
    ),
    SUM ( [Pct] ),
    ,
    DESC
)

Is it not possible to run a RANKX over a filtered table function?

Thanks

Mark

@Mark,

Looking at your DAX for Measure 2, I can see two immediate problems:

  1. DAX evaluates “outside in”, and so it is trying to filter on your virtual [Rank] column before that column is defined. Try defining your virtual table (the portion in the red box) as a variable first (say, vTable), and then call that variable in the table parameter of the FILTER function of the RETURN component (or a subsequent variable) in your measure.

  2. Columns in virtual tables can’t be called using simple aggregation functions - thus that part of your measure will need to look like this:

SUMX(
vTable,
[Pct]
)

I hope this is helpful.

  • Brian
1 Like

Hi @Mark, A response on this post has been tagged as “Solution”. If you have a follow question or concern related to this topic, please remove the Solution tag first by clicking the three dots beside Reply and then untick the check box. Thanks!

Hi Brian and all,

Sorry for the delayed response - things very much upside down here, as I am sure they are for all.

However I have spent hours on this problem, been through countless DNA TV videos but still haven’t got what I want and starting to loose the will.

Using Sam’s ‘Who are my Top 3 Salespeople’ report, I have managed to replicate the problem I have and need to solve - please see attached.

The objective is to find the Top 1 Sales Persons per location based on Measure A and then rank these top people on Measure B. Then to combine these two ranks scores to give me a FINAL RANK.

So using the example, Measure A is [Total Sales] and Measure B is [Total Profits]. I have then created ranking columns on both, a combined score and finally a FINAL RANK. However my FINAL RANK score is incorrect:

Any help very gratefully received.

Thanks and stay safe all!

Mark.

Ok, still working on this and getting a little closer…

My FINAL RANK column just needed a DENSE clause added to end of the RANKX function. It is now ranking nearly as expected, but is starting from 2.

I am sure this is to do with the fact that I am currently having to use IF statements on all of my rankings (Total Sales, Total Profits and FINAL RANK) to filter out all rows which didn’t return a TOP 1 Total Sales value.

If I remove these IF clauses, my table returns rankings which don’t apply to the TOP 1 Sales Person:

If anyone could help me correct RANK Sales and RANK Profits, so that they only RANK their associated measures for the TOP 1 Sales Persons only, without the the need for this IF statement I would be enormously grateful!

Thanks

Mark

Hi @BrianJ

Apologies, I realised that I hadn’t responded directly to your reply. Thanks for your advice on DAX working inside out - makes sense now.

However I am still struggling with this one and if you see my post previous to this, you will see that I have replicated my problem using one of Sam’s reports, in the hope of simplifying things for all to undertsand (see Combing Ranks to give FINAL RANK 2.pbix)

I feel that good Dax shouldn’t rely on having to use IF statements to filter out where values are being returned which aren’t relevant, such as my RANK Sales and RANK Profits measures and I think this is the reason my FINAL RANK measure is starting at 2.

I am pretty sure the answer will be straight forward and will likely come from using a summarised table in the last measures, to filter only the Top 1s and only rank those, but I am really struggling to get to grips with how to summarise two fields from 2 dim tables (Locations[Name] and Salespeople[Salesperson Name])?

If you would be able to take another look at this latest example I would so grateful!

Many thanks

Mark

@Mark,

Sure – I’ll be glad to take a look later today and let you know what I find.

  • Brian

@Mark,

Had to work really late tonight. Started on this one, but didn’t finish - should have a solution for you Wednesday.

Question - is there a business reason you created the crossjoin table virtually, rather than as a DAX physical table? If not, the latter will definitely make the solution easier.

  • Brian

HI @BrianJ

Thank you for picking this up again.

Regarding your question, I am using CROSSJOIN in my ranking measure as this is how Sam demonstrates how to rank over multiple dimensions - see video Practical examples for using ranking functions in the Mastering DAX Calculations course.

RANKX(
    CROSSJOIN(
        ALLSELECTED( Locations[Name] ),
        ALLSELECTED( Salespeople[Salesperson Name] )
    ),
   [Total Sales - Top 1],,
    DESC,
    Dense
)

Whatever the solution, it needs to be dynamic, so that we can review the Top Sales Persons over different time periods, regions and divisions etc.

Thanks

Mark

@Mark,

Okay, I think I finally cracked this one in a way that’s fully dynamic. The tricky part here is maintaining proper context. The first TOPN 1 measures to identify the top salesperson per region by sales and profit are pretty standard TOPN, operating in context:

Top 1 Salespeople Sales per Region = 

VAR RankingContext = VALUES( Salespeople[Salesperson Name] ) 

RETURN
CALCULATE( 
    [Total Sales],
    TOPN(
        1,
        ALL( Salespeople[Salesperson Name] ),
        [Total Sales] ),
    RankingContext
)

What gets tricky is someone ranked #1 in their region in sales may not be in profit and vice versa. Thus, for the ranking of the TOPN results, we need to take location and salesperson together in context explicitly within the measure via virtual table, since now a location can have multiple salespeople in the context (one qualifying as a #1 in sales, and a second qualifying as a #1 in profit)

RankXSales = 

VAR vTable =
FILTER(
    CROSSJOIN(
        ALL( Locations[Name] ),
        ALL( Salespeople[Salesperson Name] )
    ),
    [Top 1 Salespeople Sales per Region] <> BLANK()
)

VAR FilteredRanking =
   RANKX(
       vTable,
        [Top 1 Salespeople Sales per Region],,
        DESC,
        Dense
    )

RETURN
FilteredRanking

Here it is all put together:

I hope this is helpful. Full solution file attached below,
eDNA Forum - Combing Ranks to give FINAL RANK 2 Solution.pbix (441.2 KB)

1 Like

Hi @Mark, a response on this post has been tagged as “Solution”. If you have a follow question or concern related to this topic, please remove the Solution tag first by clicking the three dots beside Reply and then untick the check box. Thanks!

Hi @BrianJ

Thank you very much for taking the time to look at this for me, I really do appreciate it when I know you are busy.

The solution does work great, but it has left me with a couple of questions, which only if you have the time, I wondered if you may be able to comment on…

Q1, I see that you still need to apply a visual level filter using ‘Top 1 Either Sales or Profits’. However when I modify the legue table only output RankXSales without this visual level filter, it does still return a rank for our non Top1’s. I don’t understand why this is, as in your RankXSales measure, shouldn’t it only be ranking over the Top1’s using vTable - eg the Top1s?

RankXSales =
VAR vTable =
    FILTER (
        CROSSJOIN (
            ALL ( Locations[Name] ),
            ALL ( Salespeople[Salesperson Name] )
        ),
       [Top 1 Salespeople Sales per Region] <> BLANK ()
    ) 
VAR FilteredRanking =
    RANKX ( vTable,[Top 1 Salespeople Sales per Region],, DESC, Dense )

RETURN
    FilteredRanking


Q2, I see that in your Revised Measures, you are using ALL rather than ALLSELECTED, eg:

RankXSales =
VAR vTable =
    FILTER (
        CROSSJOIN (
            ALL ( Locations[Name] ),
            ALL ( Salespeople[Salesperson Name] )
        ),
       [Top 1 Salespeople Sales per Region] <> BLANK ()
    ) 
VAR FilteredRanking =
    RANKX ( vTable,[Top 1 Salespeople Sales per Region],, DESC, Dense )

RETURN
    FilteredRanking

In the examples I had seen, Sam uses ALLSELECTED so that it would respect any additional slicers put in place by the user. I wanted to see how using ALLSELECTED would change the result by creating 2nd versions of your measures and indeed they do not return the correct result:

What am I missing here?

See attached with Q1 and Q2 tabs added to demonstrate my questions.
eDNA Forum - Combing Ranks to give FINAL RANK 2 Solution v2.pbix (442.6 KB)


One final thing to note, but which I don’t think changes the logic of the solution, is that my requirement was to first find the Top 1 Sales People based on Total Sales. Then to calculate a 2nd rank, using Total Profits, but only on these Top 1 Sales People based on Total Sales. I have therefore changed the Top1 Profits measure to reference Total Sales, before returning Total Sales:

Top 1 Salespeople Profits per Region =
VAR RankingContext =
    VALUES ( Salespeople[Salesperson Name] )

RETURN
    CALCULATE (
       [Total Profits],
        TOPN ( 1, ALL ( Salespeople[Salesperson Name] ),[Total Sales] ),
        RankingContext
    )

Many thanks once again for your help and time with this.

Regards

Mark

@Mark,

I can answer question one pretty directly, but question two is going to take some further exploration.

Q1: you’re correct that the virtual table is only calculating rank where the TOPN(1) measure is not blank. However, then in your visual you are overriding that filter context by placing ALL the locations back in the matrix row. That’s where you need the visual filter in place to enforce the same context in your visual that you have in your virtual table variable. IMO, the use of visual filters is not an indication of bad DAX - sometimes in cases like this it’s just the best way to reimpose the proper evaluation context.

Q2: I’d have to re-dissect the entire solution in the context of ALLSELECTED rather than ALL in order to figure out why the former isn’t working correctly. I tend to think of ALLSELECTED as the character in the heist movie who is needed because they possess one very particular, necessary skill, but they are also volatile and unpredictable, and the one most likely get everyone else killed.

If you want to take a (very) deep dive into ALLSELECTED’s unpredictable behavior, I recommend the following:

https://www.sqlbi.com/articles/the-definitive-guide-to-allselected/

  • Brian

@Mark,

Okay, I figured out what was going wrong with your ALLSELECTED construct in Q2. It has to do with how ALLSELECTED behaves when there is no explicit filter context. If instead of using ALLSELECTED as the table modifier in your CROSSJOIN statements when creating your virtual table, use VALUES instead and ALLSELECTED as your CALCULATE/CALCULATETABLE modifier and it all works fine.

Here’s an example of one of the modified measures:

image

I hope this is helpful. Full solution file attached below.

3 Likes