. Fantastic approach and great explanation. Much more efficient than the Table.Split approach I was thinking of. This actually puts us in great shape toward a solution, since looking at the order of tiebreakers:
the first two we can calculate based on the results of your approach, the third we’ve already calculated, the fourth is simple based on the data we’ve used for #3, and the last can be calculated easily through a Random.Number or RAND function call.
Once we got the web import working well, I think we can calculate all five tiebreakers in Power Query, and then all we’ll need to do is build out the logic to rank, determine if we have a tie, go to the next tiebreaker, re-rank, and keep repeating until we have only unique rankings for all teams.
I’m thinking that logic would be built in DAX, but very open to a Power Query alternative.
As always, thanks a ton for your input and expertise.
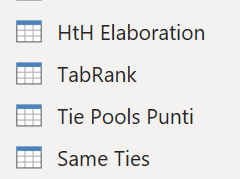
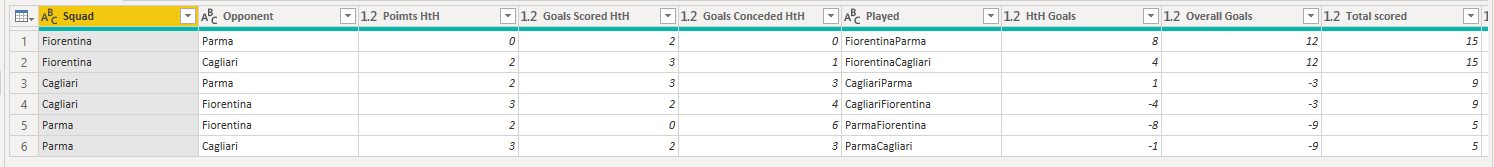
Had to do a GroupBy TeamConcat to get the HtH Goals and Squad to get the Overall Goals, then broke out into another query to get the Total scored for each team in the Tie Pool.
Thanks a lot for your amazing contribution, really fantastic. On my side still haven’t found the adequate time to seat, understand and catch up with the new solution proposed. Sorry about it. Plan to do it tonight, need to understand your ideas and techniques and try to apply them to the entire model. Will come back to you soon, I wish.
@BrianJ Yes, let me grab the baton, will try to move it further toward the finish line as much as I can
No rush at all. This was your question, so whatever timeframe works for you is fine. I’m sure @Melissa and I can find plenty of other questions to keep us busy in the interim…
I spent some time on the data and would like to wrap up where I managed to arrive so far.
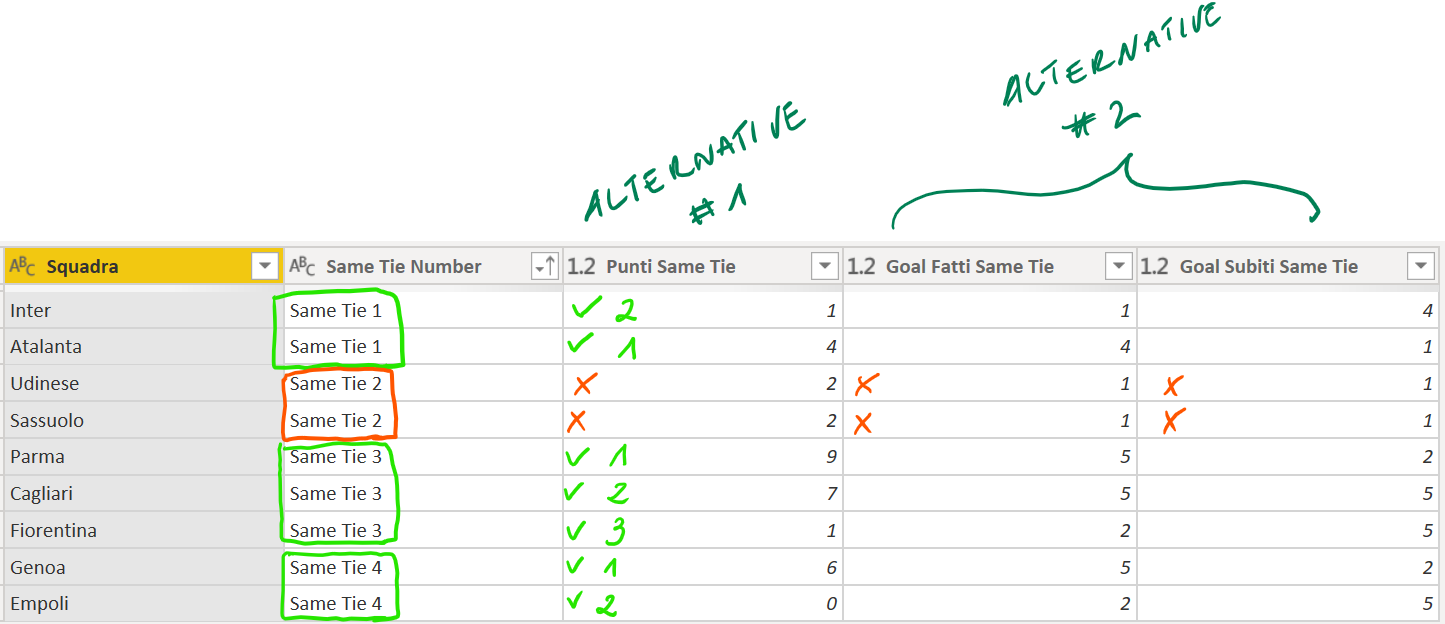
As a recap, besides the final draw, we have basically 5 subsequent criteria to calculate the Ranking, the main one is the Points gained, the alternative ones are these:
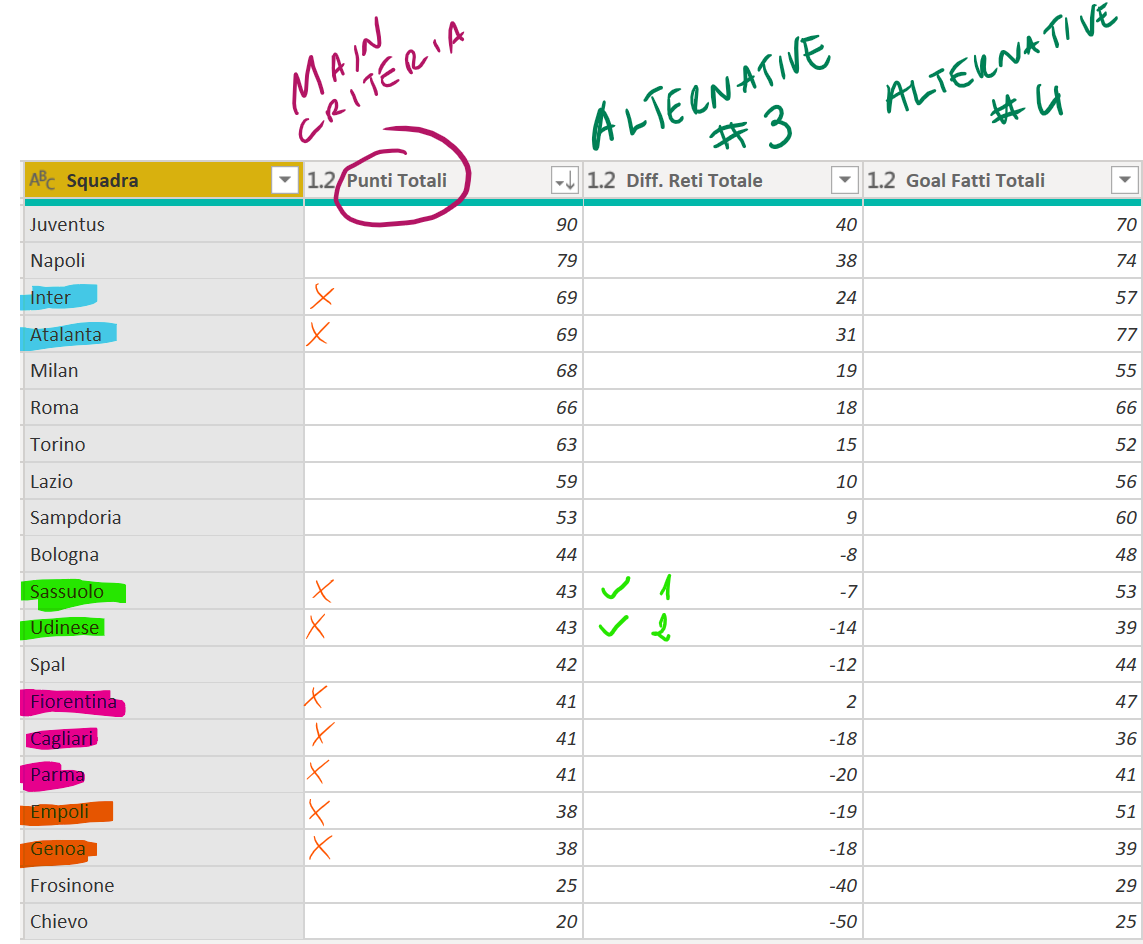
Unfortunately only Alternatives #3 and #4 can be obtained directly from the main ranking (Query TabRank):
To visualize the situation, I put red crosses where the criteria in the column is not sufficient and there is the need to evaluate the next one. Alternative #1 (Tie Pool Points) is enough for all the cases, besides the Same Tie 2, where also Alternative #2 is not sufficient and there’s the need to evaluate Alternative #3 (Goals Difference Overall).
I posted here the whole file with the data connection and the tables shown. I think now we are a bit closer to the solution, but not sure if, having these to tables with the HtH information prepared, it’s time to move to DAX to build the complete Ranking (using some EARLIER construct as reviewed before) or there’s still some elaboration needed in PQ.
I guess the PQ steps are not properly optimized as the file is pretty slow when elaborates. I was mainly focusing on understanding how to progress, maybe some efficiency can be done afterwards.
Here the tables involved in the calculations (sorry for the mess )
Sorry for the delay in responding. Been a crazy week at work, and this one is taking some time. Just wanted to let you know I’m still working it and will get back to you soon.
thanks for your message, haven’t accessed the forum for a couple of days, hence sorry for my late reply… just to say, no worries, am not in rush at all
 . Fantastic approach and great explanation. Much more efficient than the Table.Split approach I was thinking of. This actually puts us in great shape toward a solution, since looking at the order of tiebreakers:
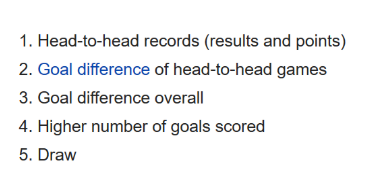

 )
)