Estimated level of difficulty :

Task 1.
Take the simplified starwars dataset available in the dplyr library.
Let’s select only the homeworld,height and mass columns from it. Our goal is to generate box plots for the numeric columns. Find a way for R to automatically search for all numeric columns and create charts based on them:
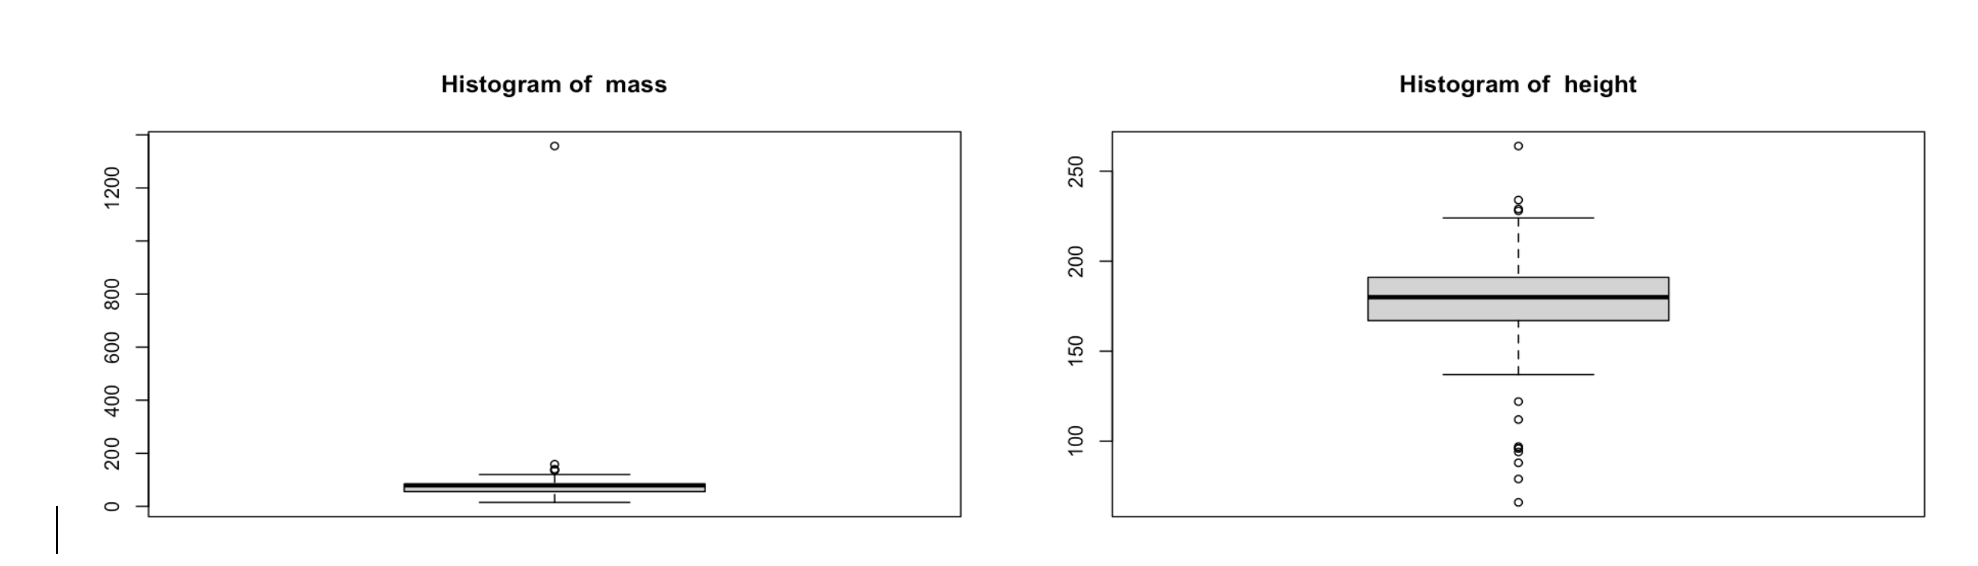
Hint: you will also need a function that will define the dimensions of the space on which the graphs will be drawn.
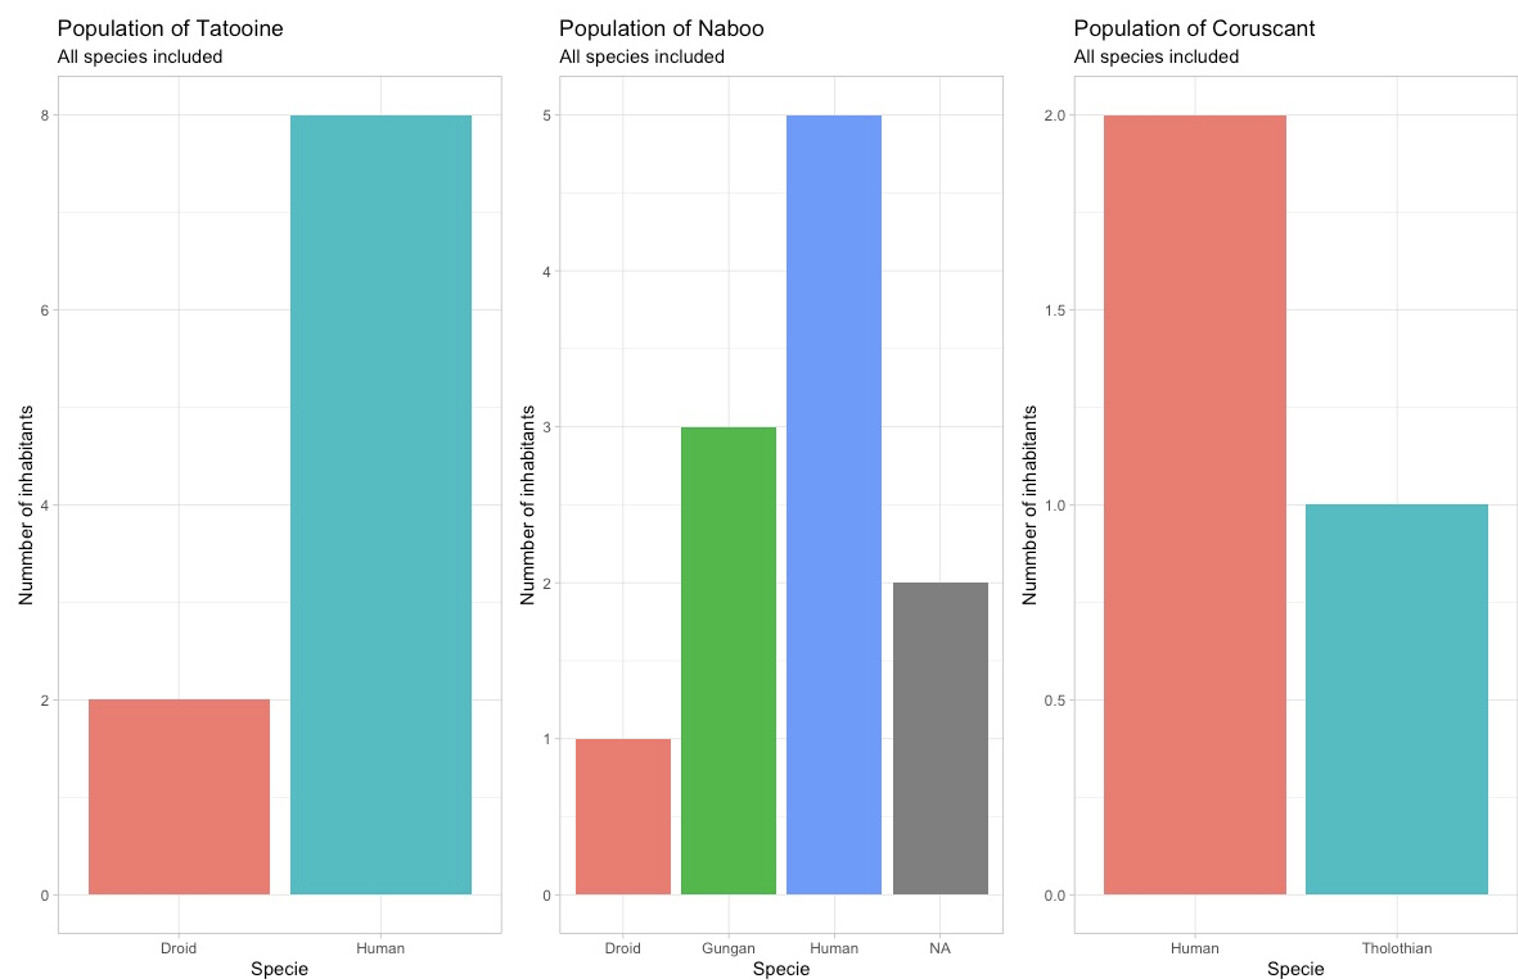
Task 2.
Create a function that will generate a graph for the selected planet from those available in the homeworld column in starwars dataset. Let the planet name in the chart title follow the “planets” parameter. Each of the following charts should generate when this one parameter is changed.
Submission
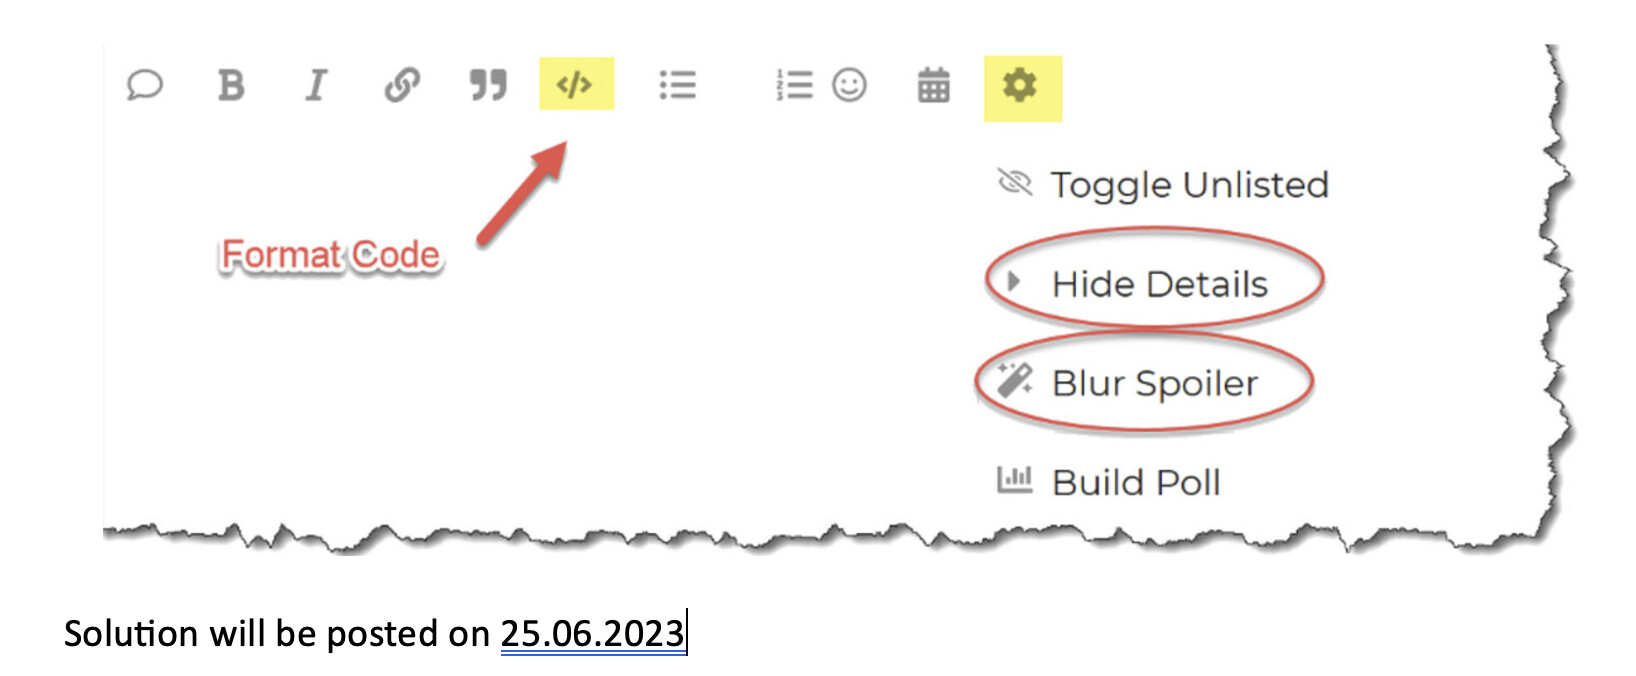
Simply post your code and a screenshot of your results.
Please format your R code and blur it or place it in a hidden section.
If you don’t have RStudio installed on Your machine, feel free to use https://rdrr.io/snippets/