We all know the advantages of working with real-world data sets. But sometimes we want to craft the data to fit our needs, and we want to do it in as dynamic a way as possible.
That is what this exercise will serve.
Task 1.
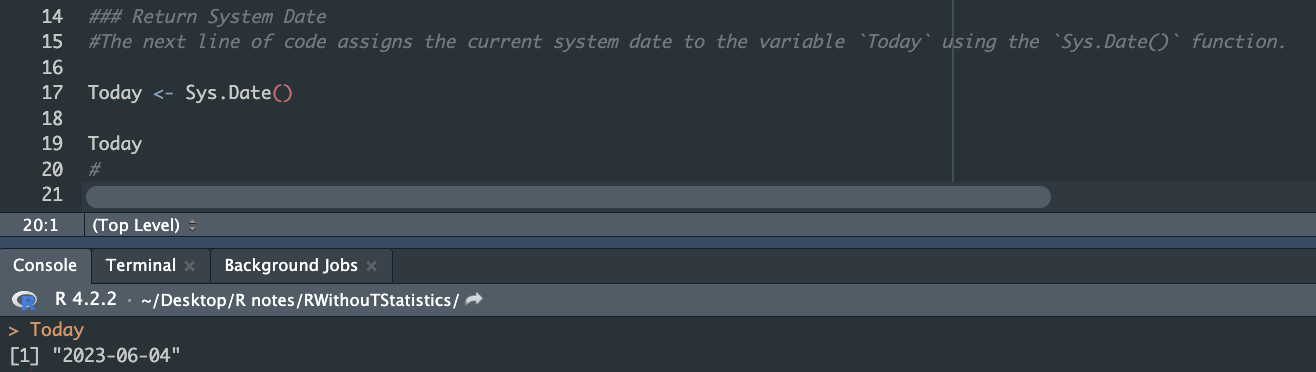
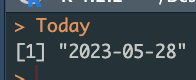
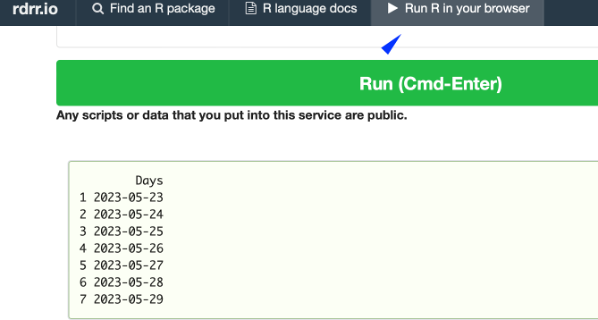
Find the R function that will indicate the system date. I am preparing this exercise on 2023-05-28 so this is the date that R should return.
Task 2.
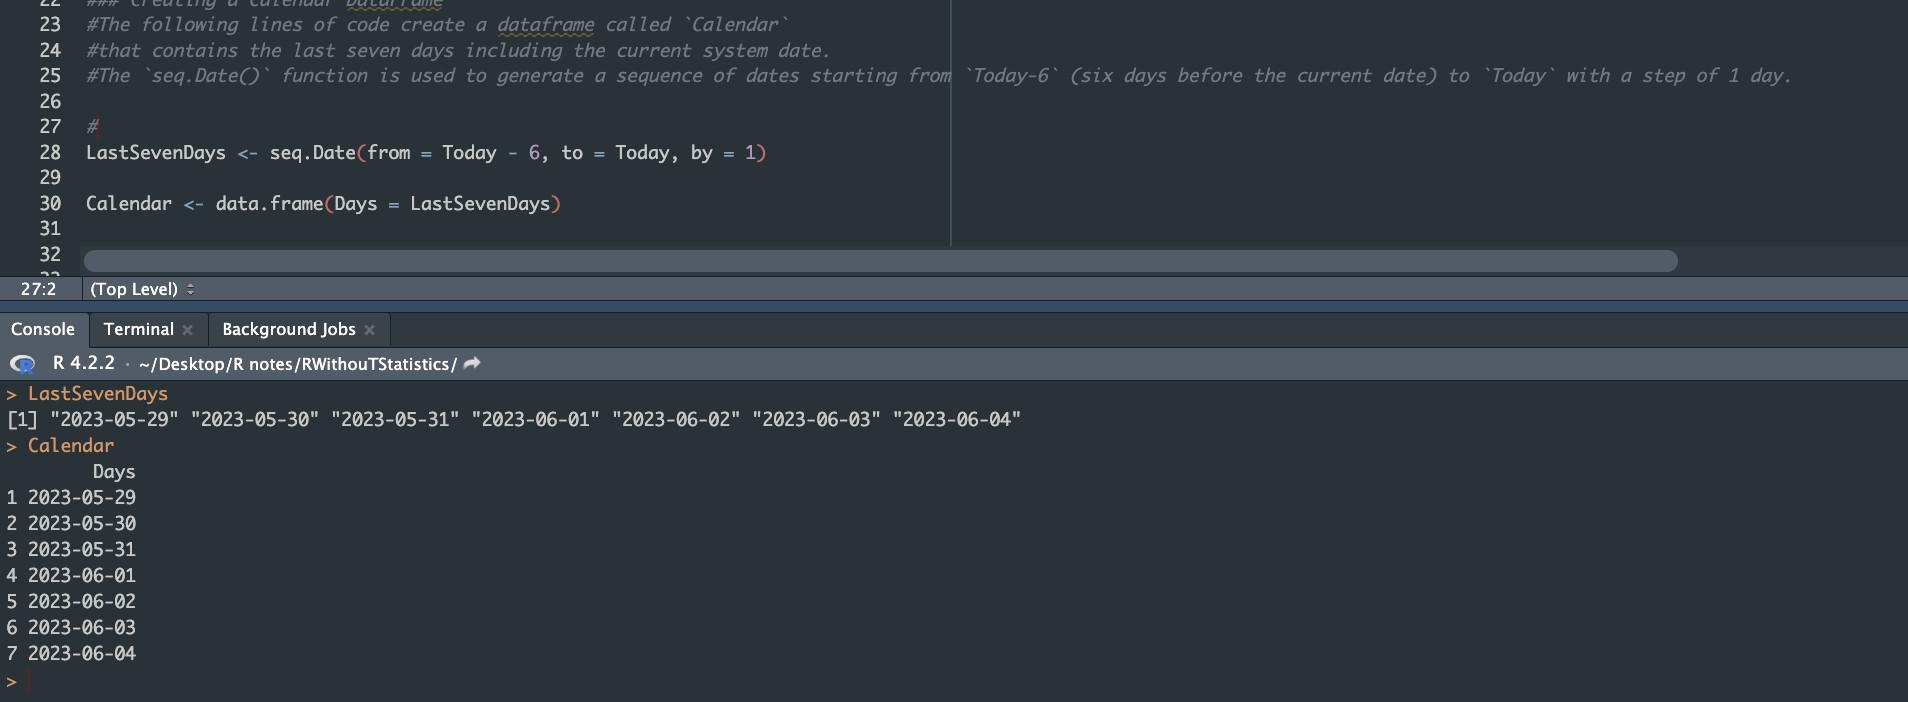
Generate a sequence of dates extending from the system date 6 days back to the system date. In my case, it will be the following series:
Task 3
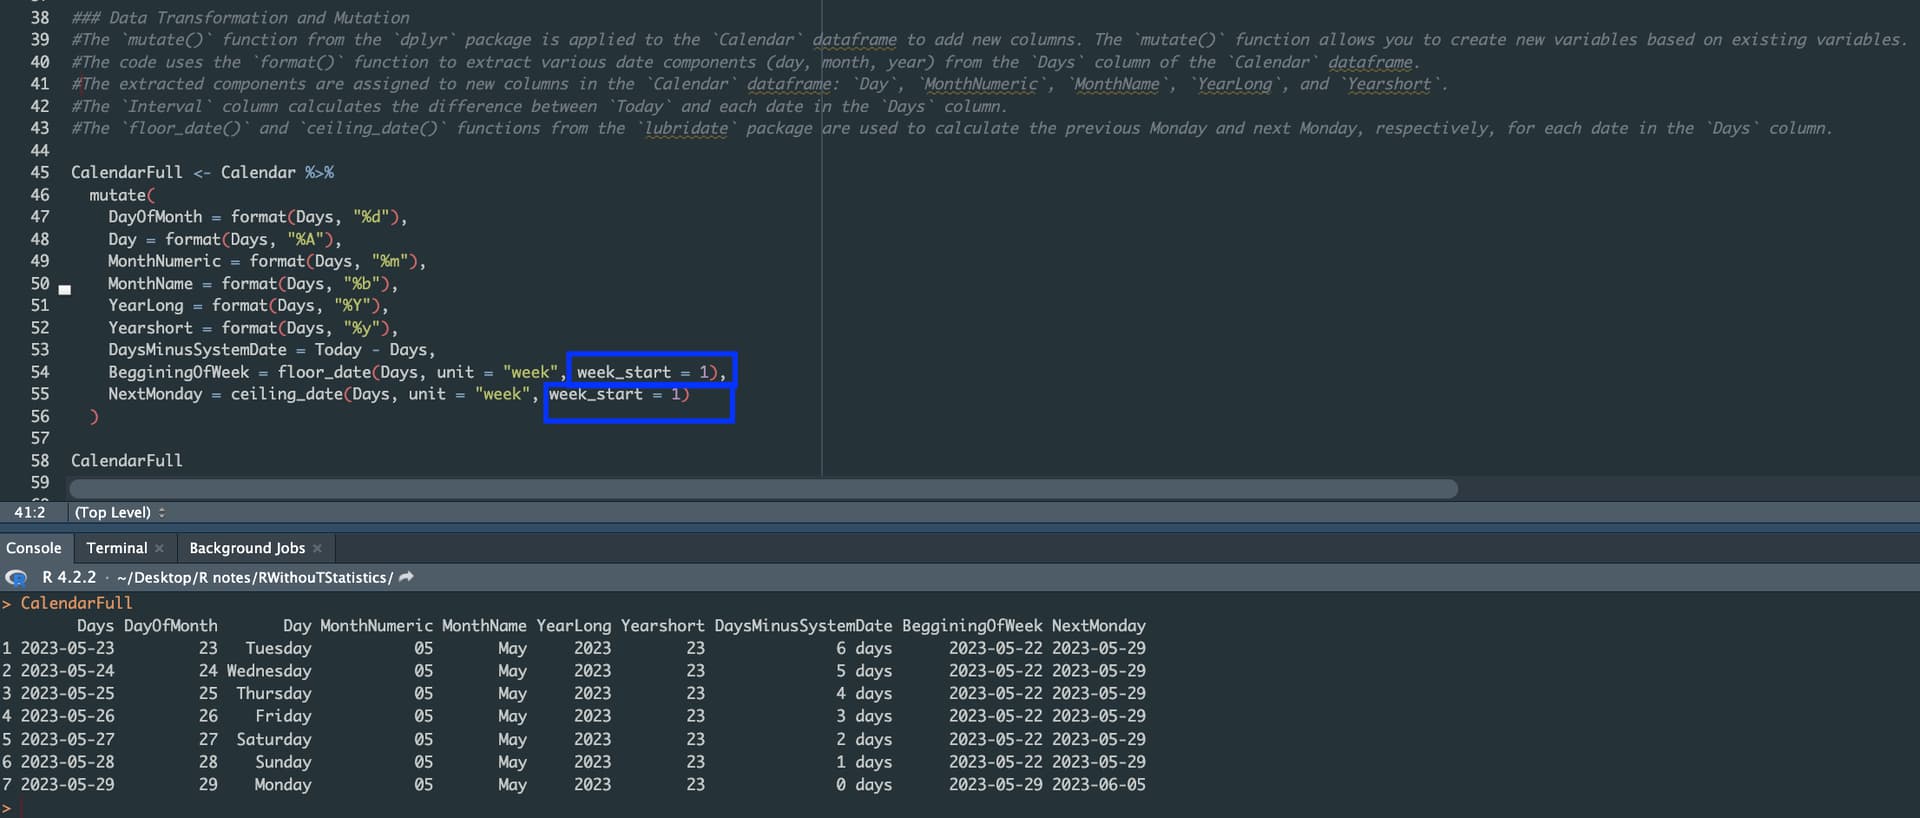
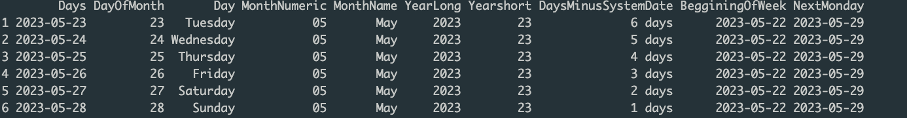
Turn this series into a Column data frame named Calendar and add the following columns. Let’s define Monday as first day of week. (I needed to rerun it on 29.05, system days changes)
Task 4
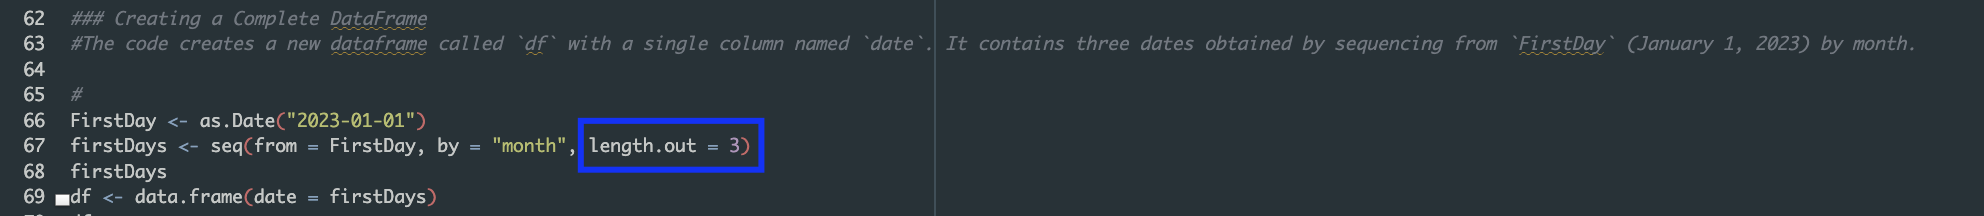
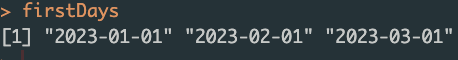
Use the variable FirstDay ← as.Date(“2023-01-01”) to generate a list of the first days of the first 3 months of 2023
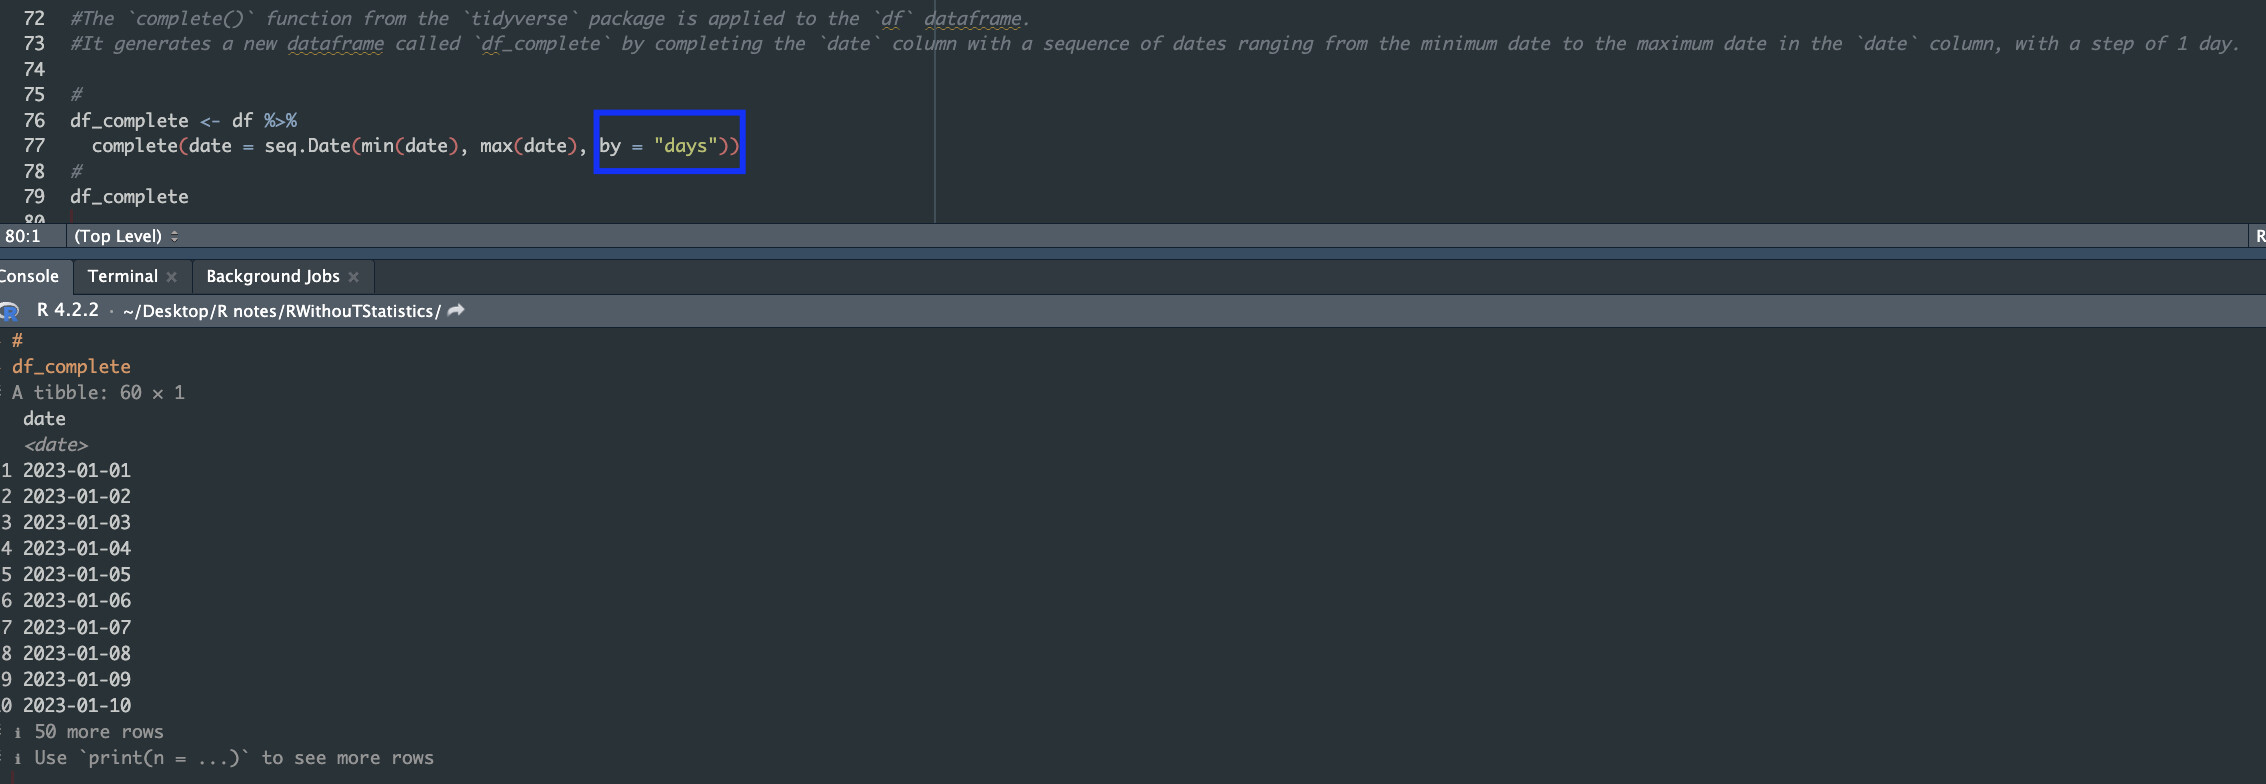
Task 5
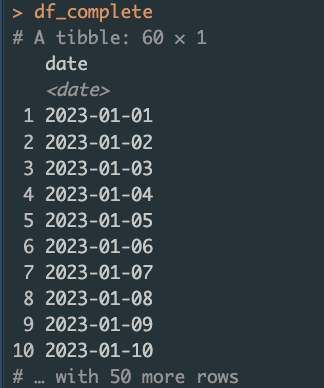
Find the function that fills the gaps between the 3 dates generated in the previous task. This should give a list of 60 days. Create data frame with dates as column.
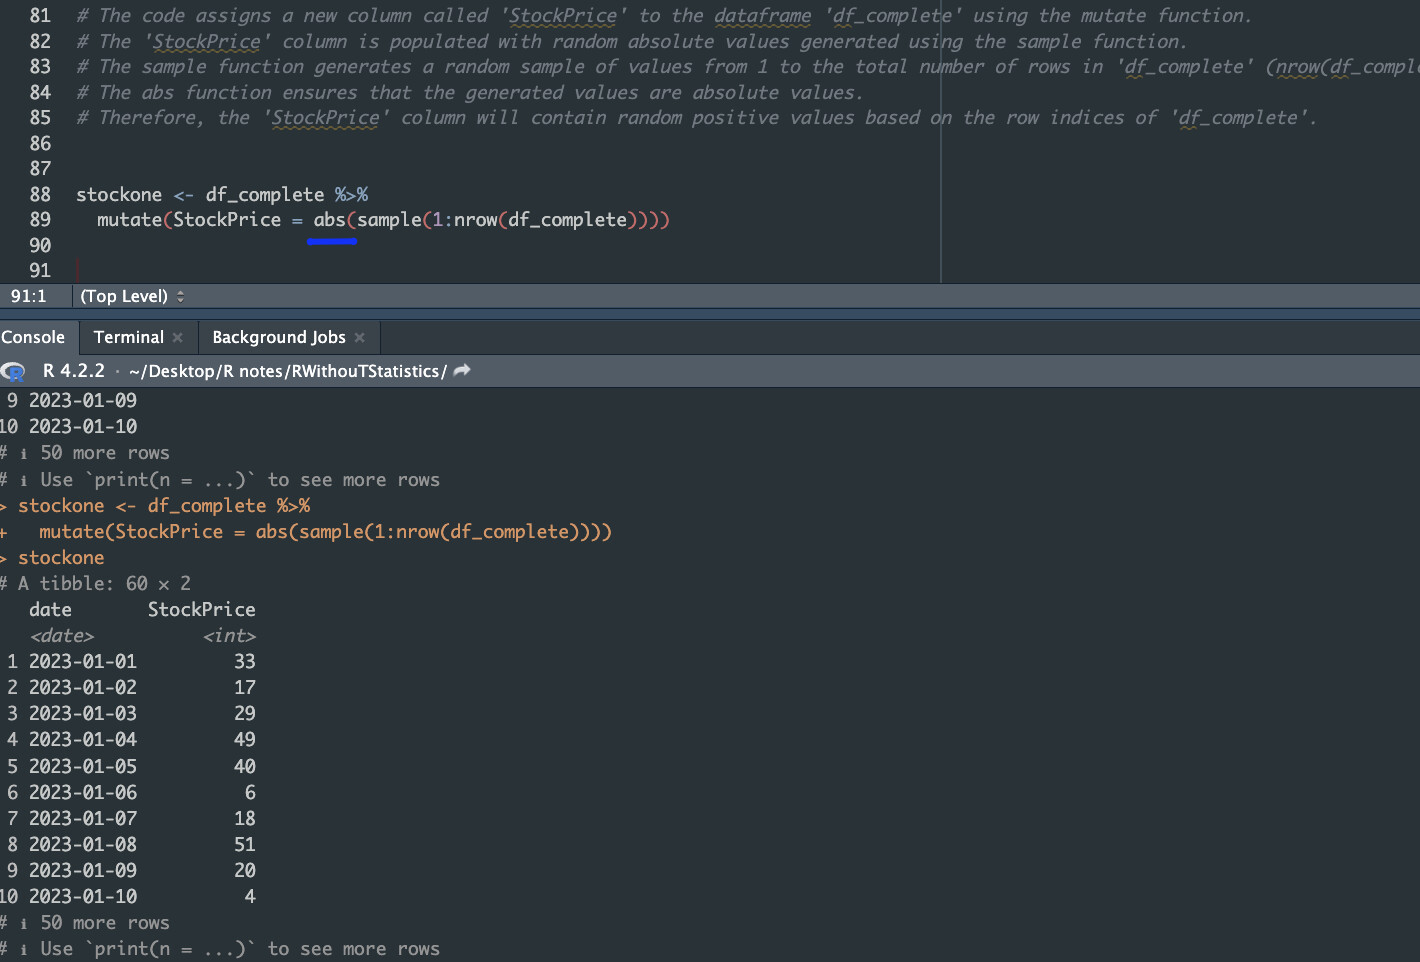
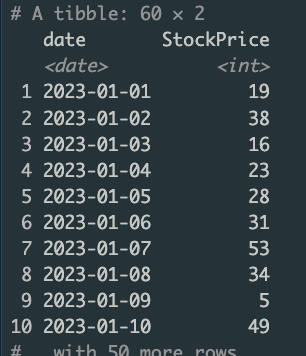
Add a StockPrice Column to list random positive values. There must be as many as dates.
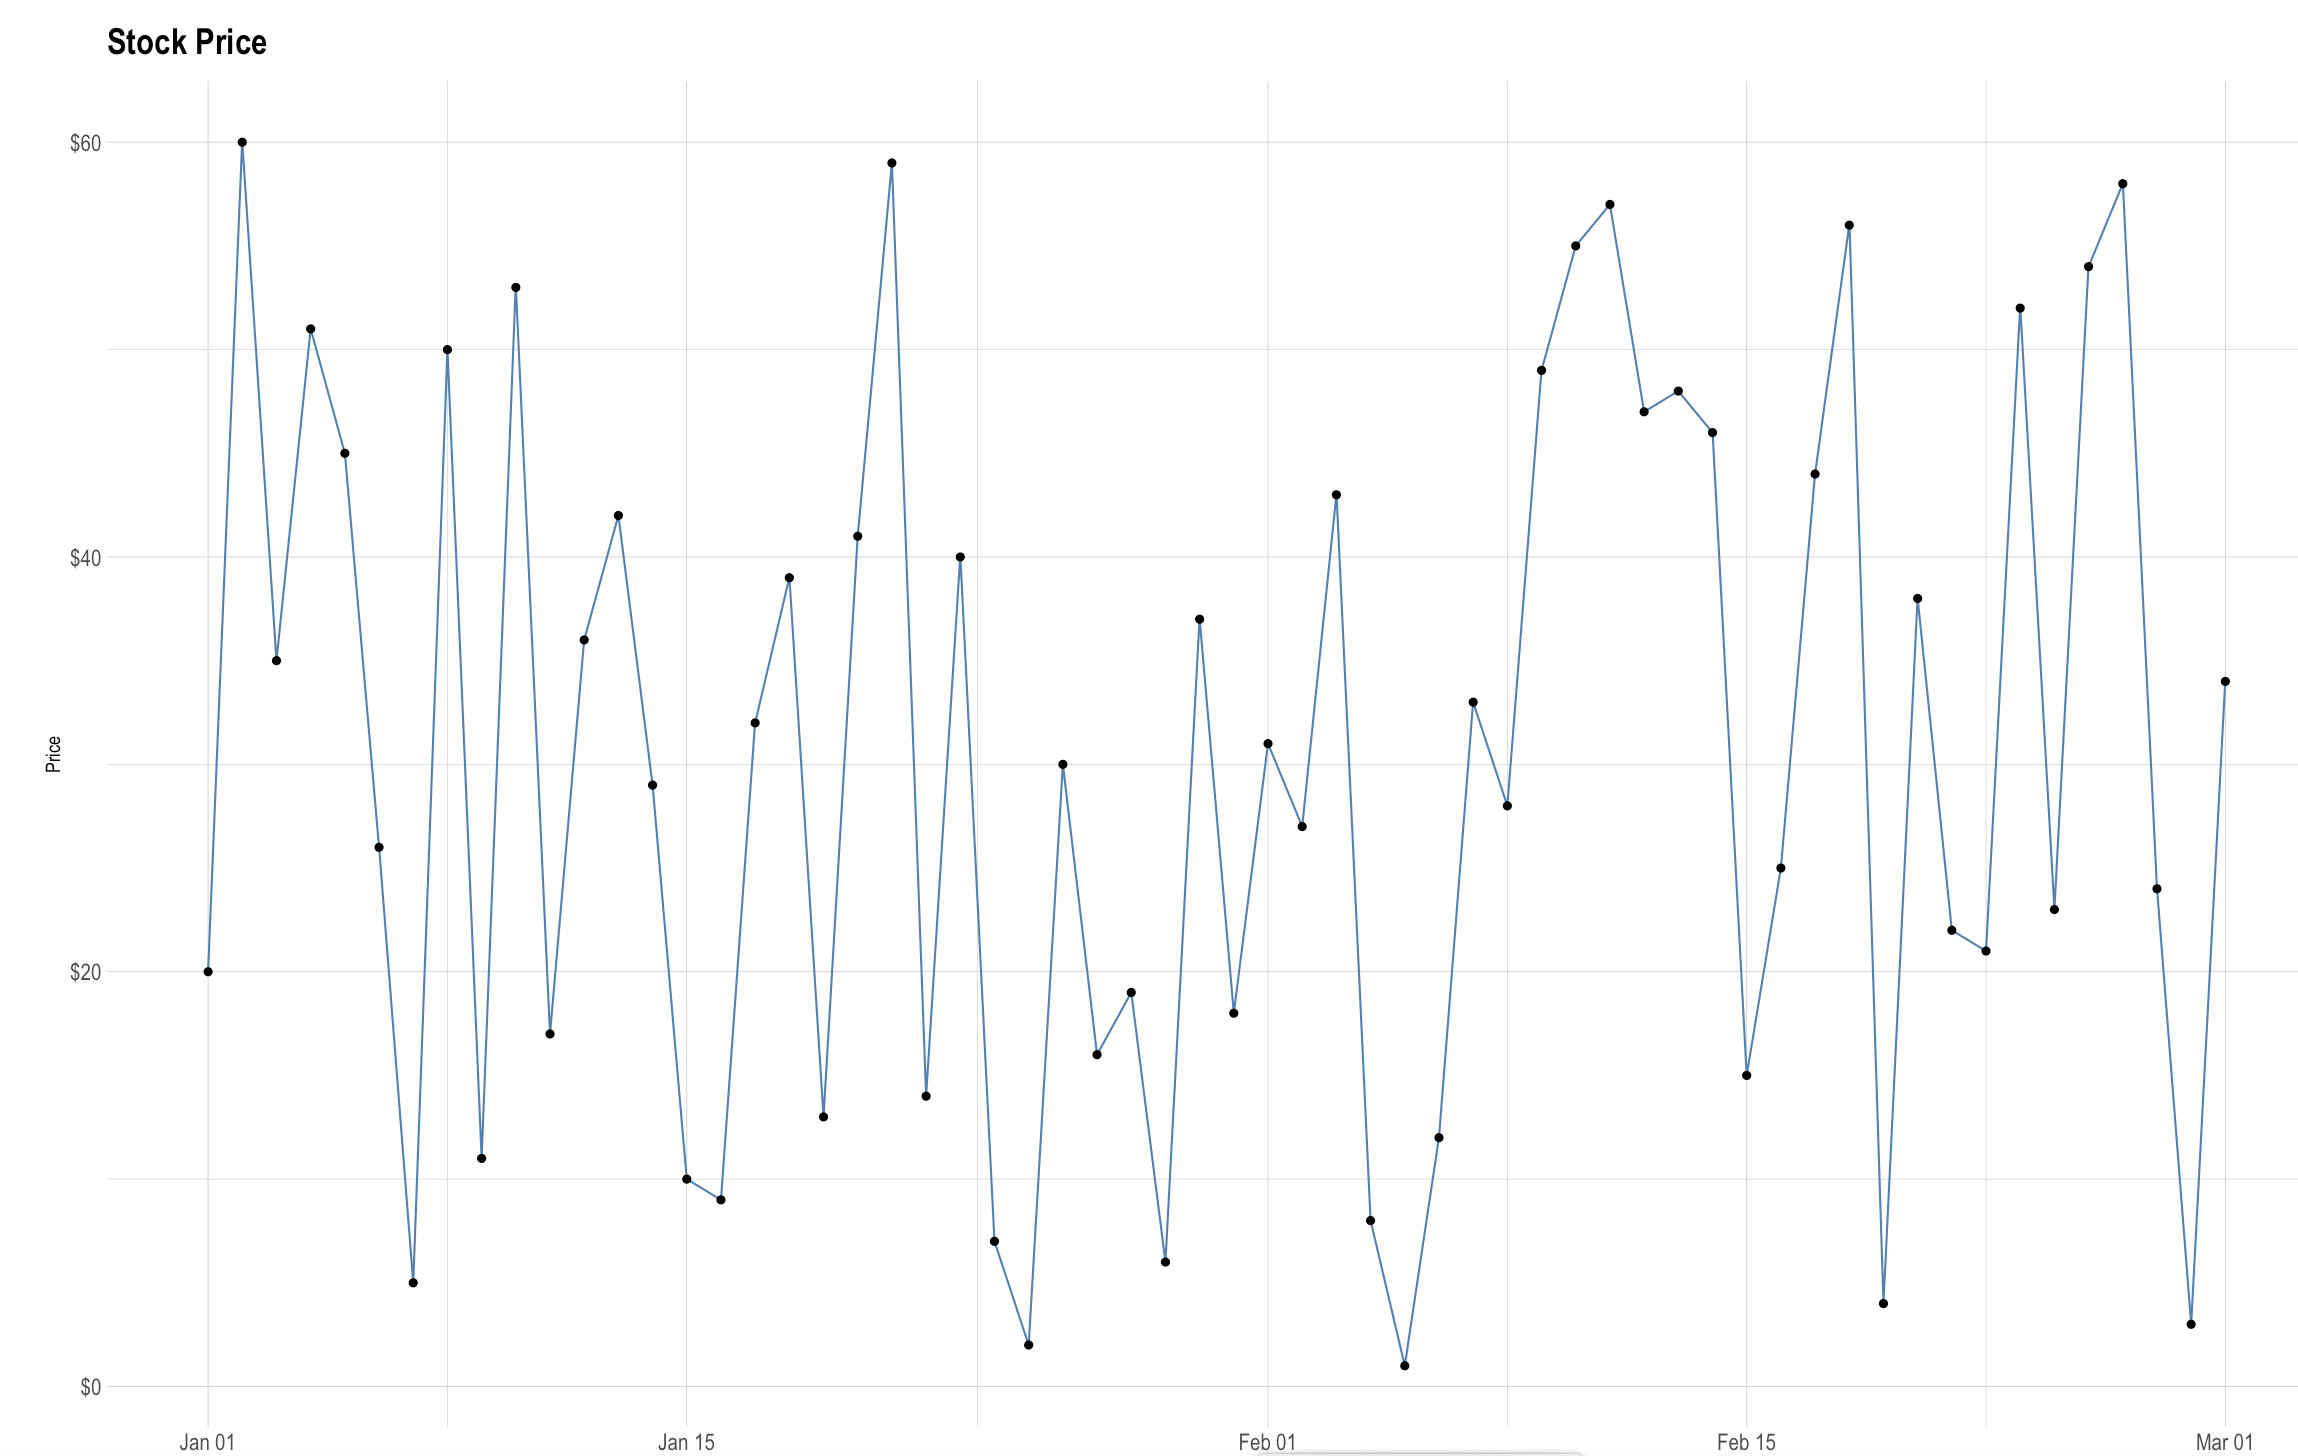
Extra task:
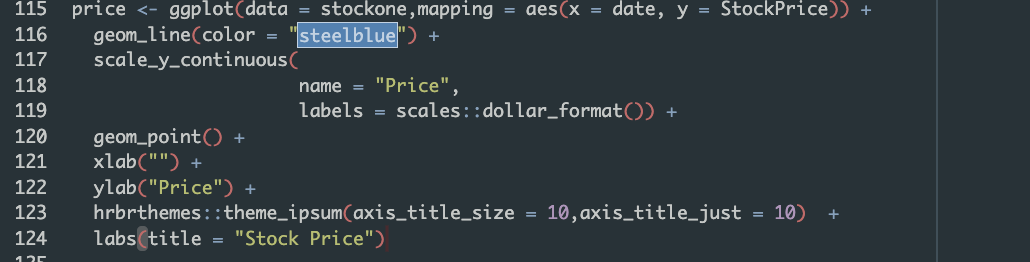
Create a plot presenting evolution of stock price.
Feel free to use R online:** **https://rdrr.io/
Solution will be posted on 04.06.2023