Estimated difficulty level:
The purpose of this exercise is to 1) Examine the structure of the dataset 2) Create bar chart with saturation 3) Create a frequency table 4) Examine the relationship between the values in two text columns.
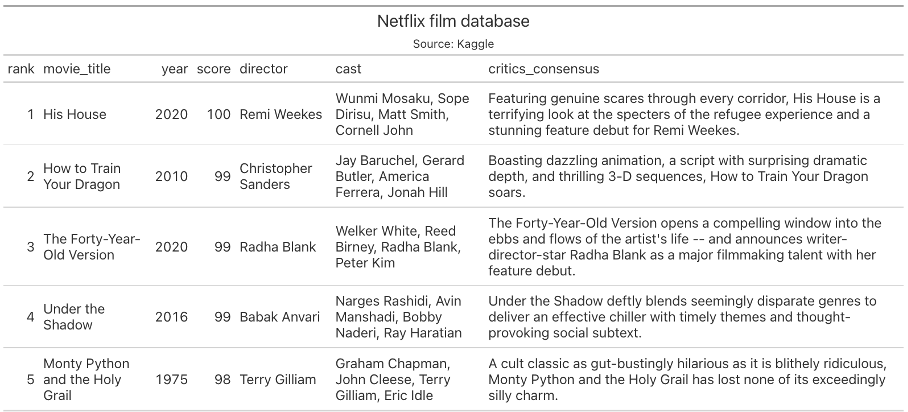
Our dataset:
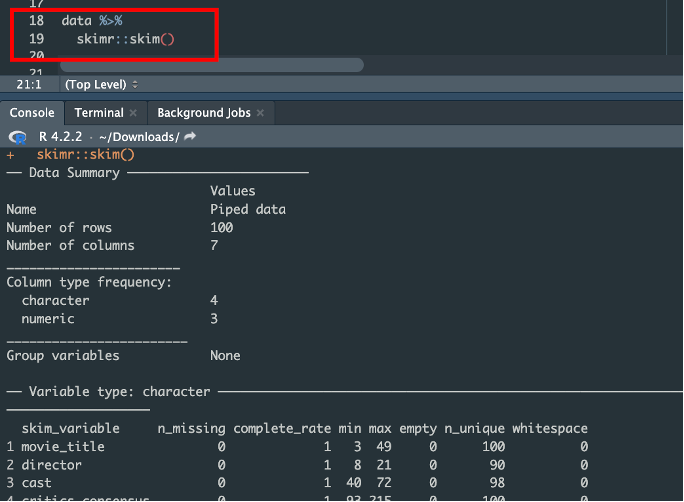
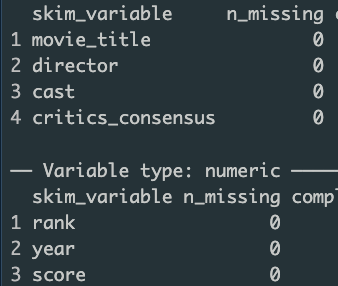
Task 1. Find and apply a function that summarizes the data and informs us of any missing values. Example:
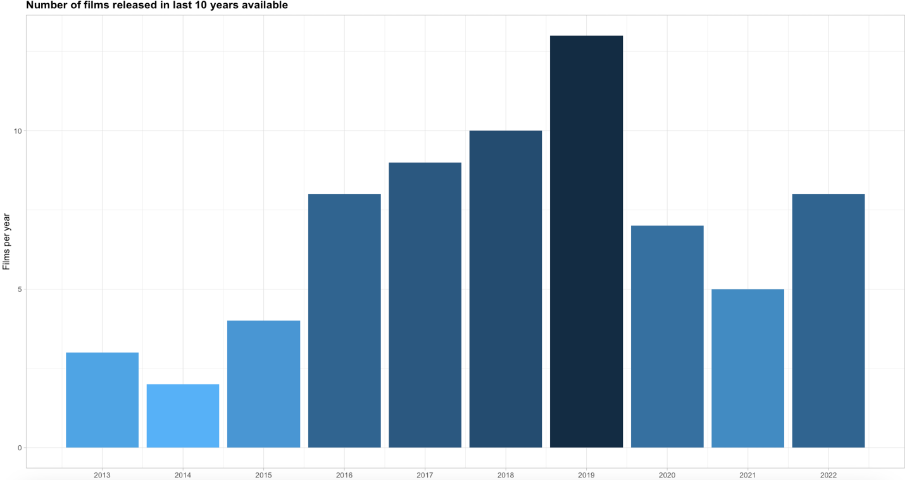
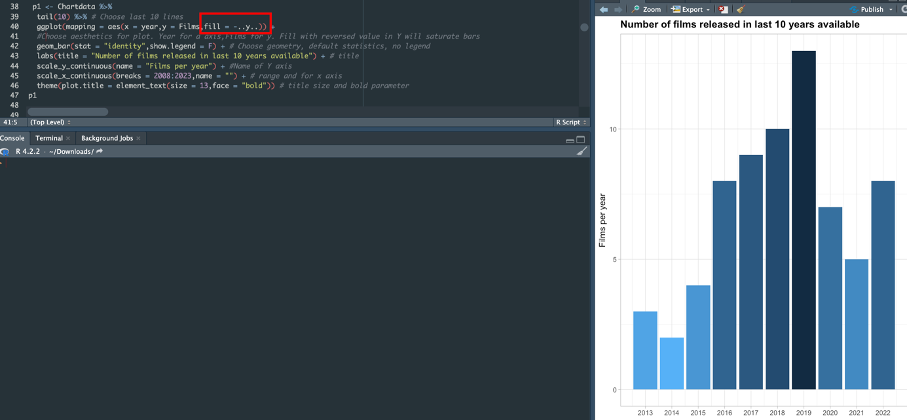
Task 2. Generate bar chart:
A. Presenting number of films released between 2013 and 2022.
B. Make sure that chart has title – size of font should be bigger that size of axis text and bold. Bars should be saturated accordingly to number of movies – highest number, highest saturation. Style is up to You.
Extra task: Create charts using function.
Example:
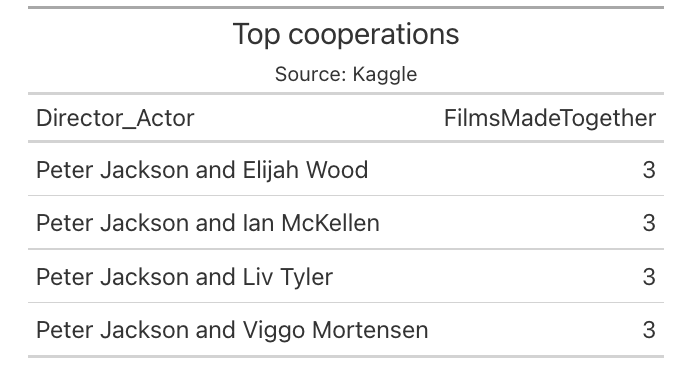
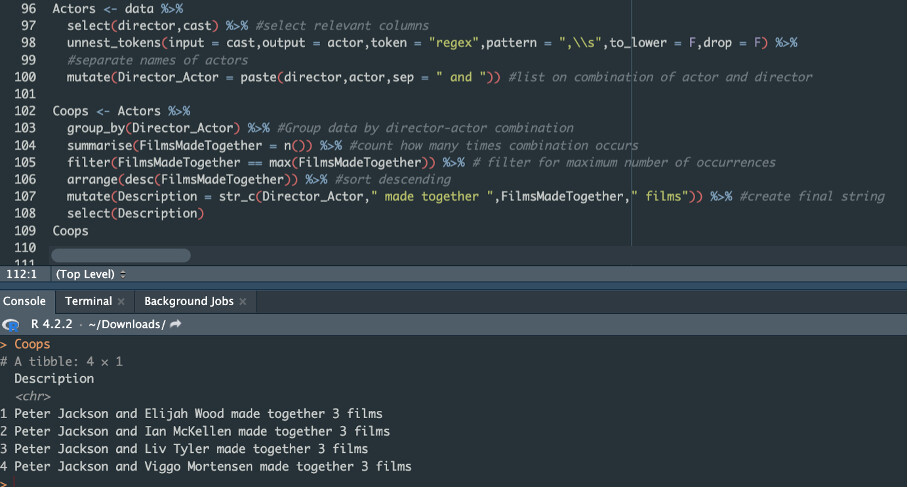
Task 3. List most common combinations of director and actor (single name in in cast column).
Examples of how you can present answer:
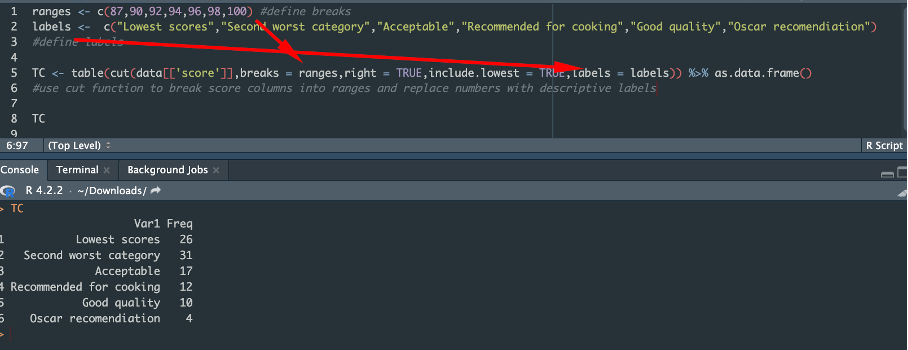
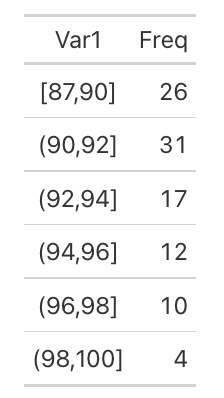
Task 4. Take score columns and build frequency table, showing how many movies falls under range. Feel free to experiment with number of breaks, but make sure that in the end number of films equals number in raw table.
Example:
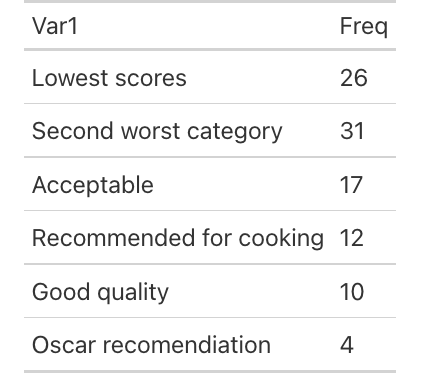
Extra task: Put Your own labels on ranges:
#Source
url ← “https://storage.googleapis.com/kagglesdsdata/datasets/3127403/5396051/100%20Best%20Movies%20on%20Netflix.csv?X-Goog-Algorithm=GOOG4-RSA-SHA256&X-Goog-Credential=gcp-kaggle-com%40kaggle-161607.iam.gserviceaccount.com%2F20230513%2Fauto%2Fstorage%2Fgoog4_request&X-Goog-Date=20230513T102333Z&X-Goog-Expires=259200&X-Goog-SignedHeaders=host&X-Goog-Signature=660e74b82755aaec724f93018d07f623e4115190637ac923aa9ca1bb2d2c03684780d9e11e308527fa5bc04cddb590cd1991c491e7e572353218feb13d2b27e38246c7292f2be3680994b40b6e6be3c1d3316f3a3d6a4509a157843e40a663ddd955c59fda67484c405589e84f3b5fc602c17ac1759ccf3de2d48f574c822806f3ed27a9023f8a2f943800c6ddcc175342b35775f23725a9dbc2f39fb6e82902b5ac3f1470d5a1fd3ade2d51840a5c8f84463c26e0a57aa935ab34240b6ecaec1a38bf7b2b0b3a4d86ae533ede6689c90bc03426730259e1065f1f9bd15d8b33fdae1f15d1f571a44c45ffac6254294b387c7e5a48f8e6c9d2b78231ef516515”
#read data
data ← read_csv(url)
Submission
Simply post your code and a screenshot of your results.
Please format your R code and blur it or place it in a hidden section.
Solution will be posted on May 21
1 Like
Hello All.
Task 1. Find and apply a function that summarizes the data and informs us of any missing values. Example:
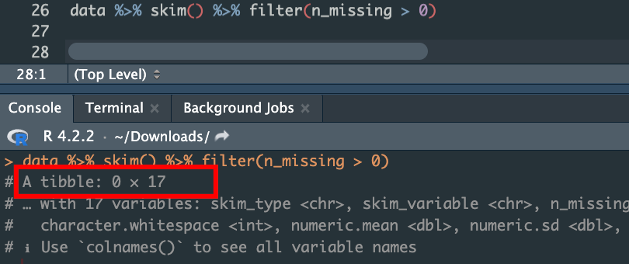
I decided to use skim() function from {skimr} library.
What is interesting in this function is that You can also filter results. It this case we want to choose lines where n_missing is bigger that 0. Result is empty:
Task 2. Generate bar chart:
First I create Chartdata obiect. It contains numer of films per year.
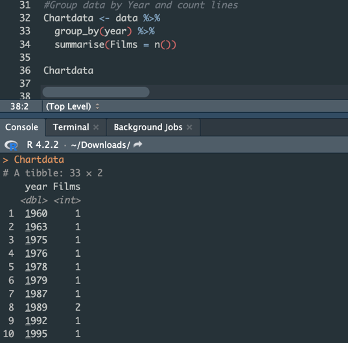
Second step. Chart with comments:
Task 3. List most common combinations of director and actor.
It requires unnest_tokens function which will separate actors names.
Task 4. Take score columns and build frequency table, showing how many movies falls under range. Feel free to experiment with number of breaks, but make sure that in the end number of films equals number in raw table.
Regards