Hello Community,
I plotted a radar plot using vega to interact in power bi. However, even though I am using pbiNominal as a way to fetch the pbi theme colors. If I use the another pbi visual the with same chart variables they do not match. See below:
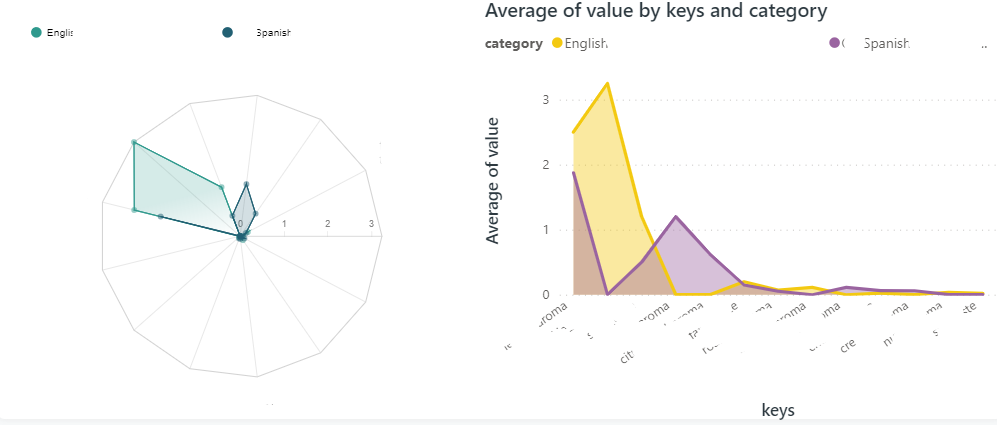
Here you can see that in the radar plot it fetches green and blue (the first two colors in my theme), however, the line chart assigns the colors based on the values in the categorical field.
Is there a way to match them?
you can find my code below. I did not attach my pbi file because the answer is either simple, or not possible. If you still require it let me know and I’ll attach a WIP since this has confidential data.
Kind regards,
Miguel
  "width": 450,
  "height": 400,
  "padding": {
    "left": 100,
    "top": 100,
    "bottom": 100
  },
  "autosize": {"type": "none", "contains": "padding"},

  "signals": [
    {"name": "radius", "update": "(width / 2)-40"}
  ],

  "data": [
    {
      "name": "dataset"},
    {
      "name": "keys",
      "source": "dataset",
      "transform": [
        {
          "type": "aggregate",
          "groupby": ["key", "average_intensity"]
        }
      ]
    }
  ],

  "scales": [
    {
      "name": "angular",
      "type": "point",
      "range": {"signal": "[PI, -PI]"},
      "padding": 0.5,
      "domain": {
        "data": "dataset",
        "field": "key",
        "sort": {"op": "average", "field":"value"}
      }
    },
    {
      "name": "radial",
      "type": "linear",
      "range": {"signal": "[0, radius]"},
      "zero": true,
      "nice": false,
      "domain": {
        "data": "dataset",
        "field": "value"
      },
      "domainMin": 0
    },
    {
      "name": "color",
      "type": "ordinal",
      "domain": {
        "data": "dataset",
        "field": "category"
      },
      "range": {"scheme": "pbiColorNominal"}
    }
  ],

  "axes": [
    {
    "orient": "top",
    "scale": "radial",
    "domainWidth": 0.2,
    "tickCount": 4,
    "tickWidth": 0.2,
    "labelFlush": false,
    "labelFontSize": 9,
    "labelColor": "gray"
    }
  ],

  "encode": {
    "enter": {
      "x": {"signal": "radius"},
      "y": {"signal": "radius"}
    }
  },
  "marks": [
    {
      "type": "group",
      "name": "categories",
      "zindex": 1,
      "from": {
        "facet": {
          "data": "dataset",
          "name": "facet",
          "groupby": ["category"]}
      },
      "marks": [
        {
          "type": "line",
          "name": "category-line",
          "from": {"data": "facet"},
          "sort": {"field": "datum.average_intensity"},
          "encode": {
            "enter": {
              "interpolate": {"value": "linear-closed"},
              "x": {"signal": "scale('radial', datum.value__highlight) * cos(scale('angular', datum.key))"},
              "y": {"signal": "scale('radial', datum.value__highlight) * sin(scale('angular', datum.key))"},
              "stroke": {"scale": "color", "field": "category"},
              "strokeWidth": {"value": 1},
              "fill": {"scale": "color", "field": "category"},
              "fillOpacity": {"value": 0.2}
            }
          }
        },
        {
          "type": "line",
          "name": "category-line-highlighted",
          "sort": {"field": "datum.average_intensity"},
          "from": {"data": "facet"},
          "encode": {
            "enter": {
              "interpolate": {"value": "linear-closed"},
              "x": {"signal": "scale('radial', datum.value__highlight) * cos(scale('angular', datum.key))"},
              "y": {"signal": "scale('radial', datum.value__highlight) * sin(scale('angular', datum.key))"},
              "stroke": {"scale": "color", "field": "category"},
              "strokeWidth": {"value": 1},
              "fill": [
                {
                  "test": "datum.__selected__ == 'on'",
                  "scale": "color",
                  "field": "category",
                  "value": 0
                }
              ]
            }
          }
        },
        {
          "type": "symbol",
          "name": "symbol-category",
          "from": {"data": "facet"},
          "encode": {
            "enter": {
              "x": {"signal": "scale('radial', datum.value) * cos(scale('angular', datum.key))"},
              "y": {"signal": "scale('radial', datum.value) * sin(scale('angular', datum.key))"},
              "fill": {"scale": "color", "field": "category"},
              "fillOpacity": {"value": 0.5},
              "size": {"value": 30}
            }
          }
        },
        {
          "type": "text",
          "name": "value-text",
          "from": {"data": "category-line"},
          "encode": {
            "enter": {
              "x": {"signal": "datum.x"},
              "y": {"signal": "datum.y"},
              "text": {"signal": "datum.datum.value"},
              "align": {"value": "center"},
              "baseline": {"value": "middle"},
              "fill": {"value": "black"},
              "fillOpacity": { "value": 0}
            }
          }
        }
      ]
    },
    {
      "type": "rule",
      "name": "radial-grid",
      "from": {"data": "keys"},
      "zindex": 0,
      "encode": {
        "enter": {
          "x": {"value": 0},
          "y": {"value": 0},
          "x2": {"signal": "radius * cos(scale('angular', datum.key))"},
          "y2": {"signal": "radius * sin(scale('angular', datum.key))"},
          "stroke": {"value": "lightgray"},
          "strokeWidth": {"value": 0.5}
        }
      }
    },
    {
      "type": "text",
      "name": "key-label",
      "from": {"data": "keys"},
      "zindex": 1,
      "encode": {
        "enter": {
          "x": {"signal": "(radius + 15) * cos(scale('angular', datum.key))"},
          "y": {"signal": "(radius + 15) * sin(scale('angular', datum.key))"},
          "text":{"signal": "datum.key"},

          "align": [
            {
              "test": "abs(scale('angular', datum.key)) > PI / 2",
              "value": "right"
            },
            {
              "value": "left"
            }
          ],
          "baseline": [
            {
              "test": "scale('angular', datum.key) > 0", "value": "top"
            },
            {
              "test": "scale('angular', datum.key) == 0", "value": "middle"
            },
            {
              "value": "bottom"
            }
          ],
          "fill": {"value": "black"},
          "fontWeight": {"value": "bold"},
          "dx": {"value": 0},
          "dy": {"value": -10},
          "limit":{"signal": "40"},
          "lineBreak": {"value": "_"}
        }
      }
    },
    {
      "type": "line",
      "name": "outer-line",
      "from": {"data": "radial-grid"},
      "sort": {"field": "datum.datum.average_intensity"},
      "encode": {
        "enter": {
          "interpolate": {"value": "linear-closed"},
          "x": {"field": "x2"},
          "y": {"field": "y2"},
          "stroke": {"value": "lightgray"},
          "strokeWidth": {"value": 1}
        }
      }
    }
  ],
  "legends": [
    {
      "orient": "none",
      "legendX": -200,
      "legendY": -200,
      "fill": "color",
      "direction":"horizontal"
    }
  ]
}