Hi,
I was looking at the following training video [ Threshold Triggers in Power BI using DAX - Advanced Technique]. Great video however can you explain the purpose for using the countrows function as the filter expression. I do not understand how that resulting scalar value is used to filter down the table values(customer[customer names]).
Thanks in advance!
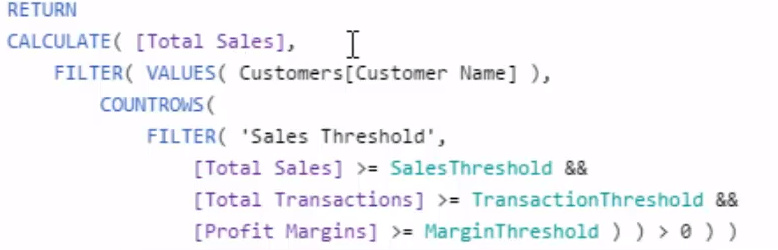
If this is the measure your talking about:
It is trying to get Total Sales by Customer Name that Total Sales was >= Sales Threshold, Total Transactions >= Transaction Threshold & Profit Margins>= Margin Threshold.
So this measure in short wants total sales by customer name that met or exceeded the threshold for Sales, Transactions & Margin for a particular quarter. He set the measure up this way due to their be no active relationship of the Sales Threshold Table that he created in the video.
Hopefully this clears the mud a little for you. I would suggest that you download the resource and have a look at Sam’s PBIX file for this to even help understand what is happening.
Thanks
Jarrett

Thanks Jones for that explanation. I understand what Sam is accomplishing here with this measure however I do not understand the specific as to how the countrows() function is operating here. When I use the filter() table function, i typically use a logic statement as the filter expression (ie. table[column] >= x). In this expression, countrows() is being used as the filter expression and so I would expect a single value would be the output here (ie. 3 rows).
COUNTROWS is searching row by row to see how many rows qualify based on the measure provided.
Thanks
Jarrett
I get this now, the logic is here and is when the number of rows meeting the specific logic is greater than 0; All others will be filtered out. Sam used this logic in the below video and it totally makes sense now. I will try to incorporate this advanced Dax in my reports.
1 Like