Hi everyone,
so I’m working on this project and even tho i mapped the colors it won’t appear in the right way
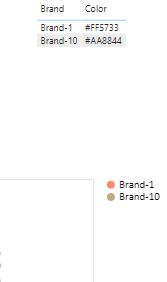
until i select Brands with the same colors it goes right , but if i add one more that has the same color of another one it starts bugging out
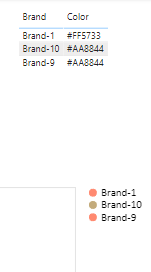
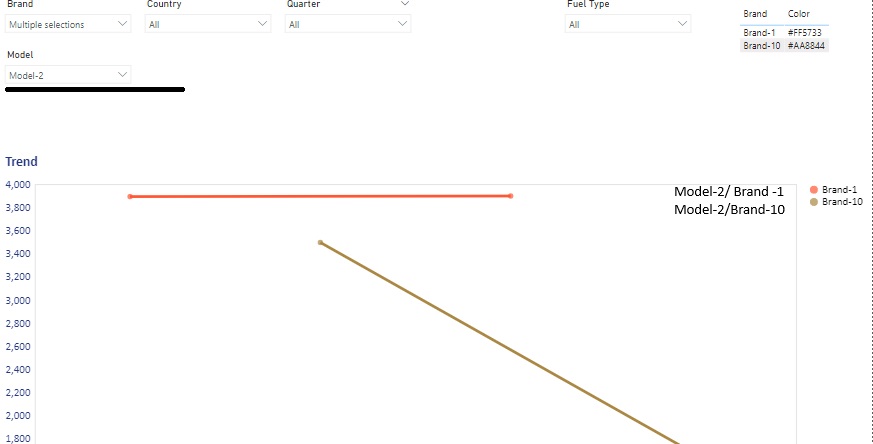
As you can see the third model added is not respecting the correct color mapping.
plus if its possible i would like to have a dynamic legend where there are not more then one model selected per brand it also show the model in the legend:
the code used for the linechart is this one :
{
  "$schema": "https://vega.github.io/schema/vega-lite/v5.json",
  "title":{
    "text":"Trend",
    "fontSize":20,
    "anchor":"start",
    "color":"#243781",
    "offset":15,
    "font":"calibri"
  },
  "description": "Linechart Trends",
  "data": {"name": "dataset"},
  "layer": [
    {
    "mark":{
      "type":"line",
      "strokeWidth":4
    },
    "encoding":{
      "x": {
        "field":"Quarter",
        "type":"nominal",
        "axis":{"labelFontSize":16,
        "title":null,"labelAngle":0,"labelColor":"#243781","tickColor":"transparent","domainColor":"transparent","labelFont":"calibri"}
      },
      "y":{
        "field":"Value",
        "type":"quantitative",
        "axis":{"labelFontSize":16,"grid":false,"title":null,"labelColor":"#243781","tickColor":"transparent","domainColor":"transparent","labelFont":"calibri"},
        "scale":{"zero":false}
      },
      "color":{
        "field": "Brand",
        "type":"nominal",
        "scale":{
          "domain":{"data":"dataset","field":"Brand"},
          "range":{"data":"dataset","field":"Color"},
          "undefined":"#EAEAEA"
        },
        "legend":{"title":null,"labelFont":"calibri","labelFontSize":16}
      },
      "detail":{
        "field":"Model",
        "type":"nominal"
    }
  }
},
{
  "mark":{"type":"point","filled":true,"size":60},
  "encoding":{
    "x":{
      "field":"Quarter",
      "type":"nominal"
    },
    "y":{
      "field":"Value",
      "type":"quantitative"
    },
    "color":{
      "field":"Brand",
      "type":"nominal"
    },
    "tooltip":[
      {"field":"Model","type":"nominal"},
      {"field":"Value","type":"nominal"}
    ]
  }
}
  ]
}
And ill’ also upload the datasets + the pbi file
Exempletofix.pbix (1.5 MB)
colors_table.xlsx (4.9 KB)
dataset_brands_models_updated.xlsx (10.0 KB)