Hi DnA team,
I have a table with inventory data for each month data from 2018-2020. However, when I am trying to use slicers to show up results for each year, quarter and month, it would automatically sum up the cumulative totals for the month/quarters/ and years.
What I am trying to achieve though, is when I click Q1, it would only show cumulative results for month 3, Q2-month 6, Q3-month 9, Q4-month 12; instead of adding up month 1,2,3 data for Q1, month 4,5,6 for Q2, month 7,8,9 for Q3 etc.
Similarly, if I click 2018, I would need the data to only show cumulative totals for month 12 only instead of adding up month 1-12 data. Inventory Analytic Tool -backup.pbix (728.8 KB)
I tried to study Sam’s post “Showing Cumulative Total Only Up to a Specific Date”, but I don’t see how that would apply to my situation.
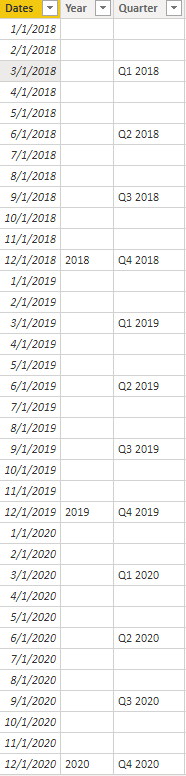
Right now, I manually forced my table to display my date table like this ; however, this makes my date slicers not intuitive at all. Any help is greatly appreciated!!
Hi @lulumoon! We noticed that your inquiry was left unsolved for quite some time now. We strive to answer ALL inquiries in the forum. However, if you are sure that you provided all pertinent context to your concerns and read how to use the forum more effectively and still find your question unanswered, you can check out tutorials to learn this yourself as your membership also comes with relevant resources that may help you with your Power BI education.
While our users and experts do as much as reasonable to help you with your inquiries, not all concerns can be attended to especially if there are some learnings to be done. Thank you!