Hello @chad.sharpe,
Thank You for posting your query onto the Forum.
In order to achieve the results based on the condition that you’ve specified. Below are the steps listed as follows -
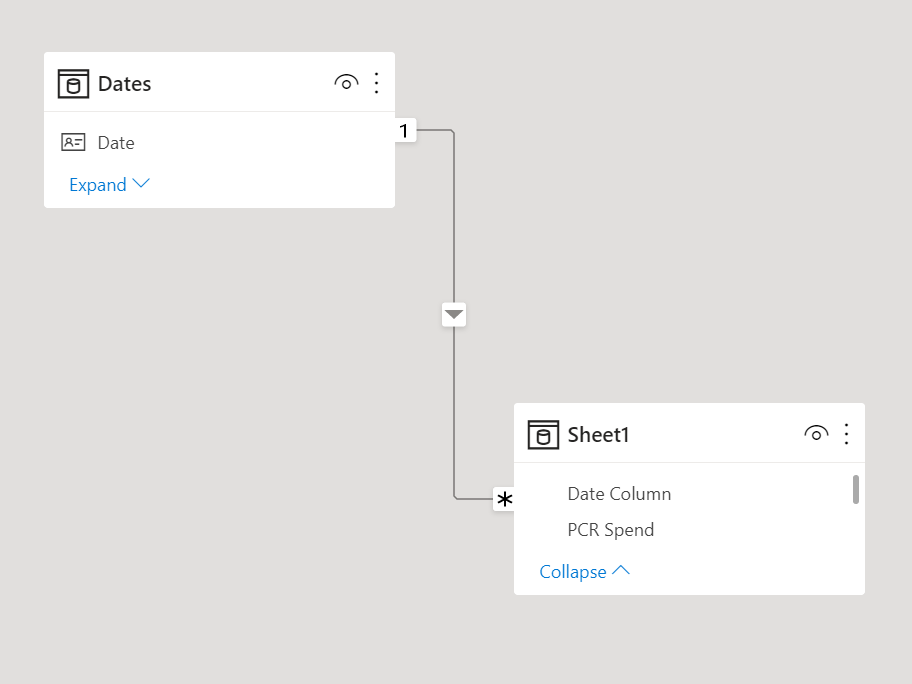
1). Remove bi-directionality relationship between the Fact Table and Dates Table. Below is the screenshot of the revised Data Model provided -
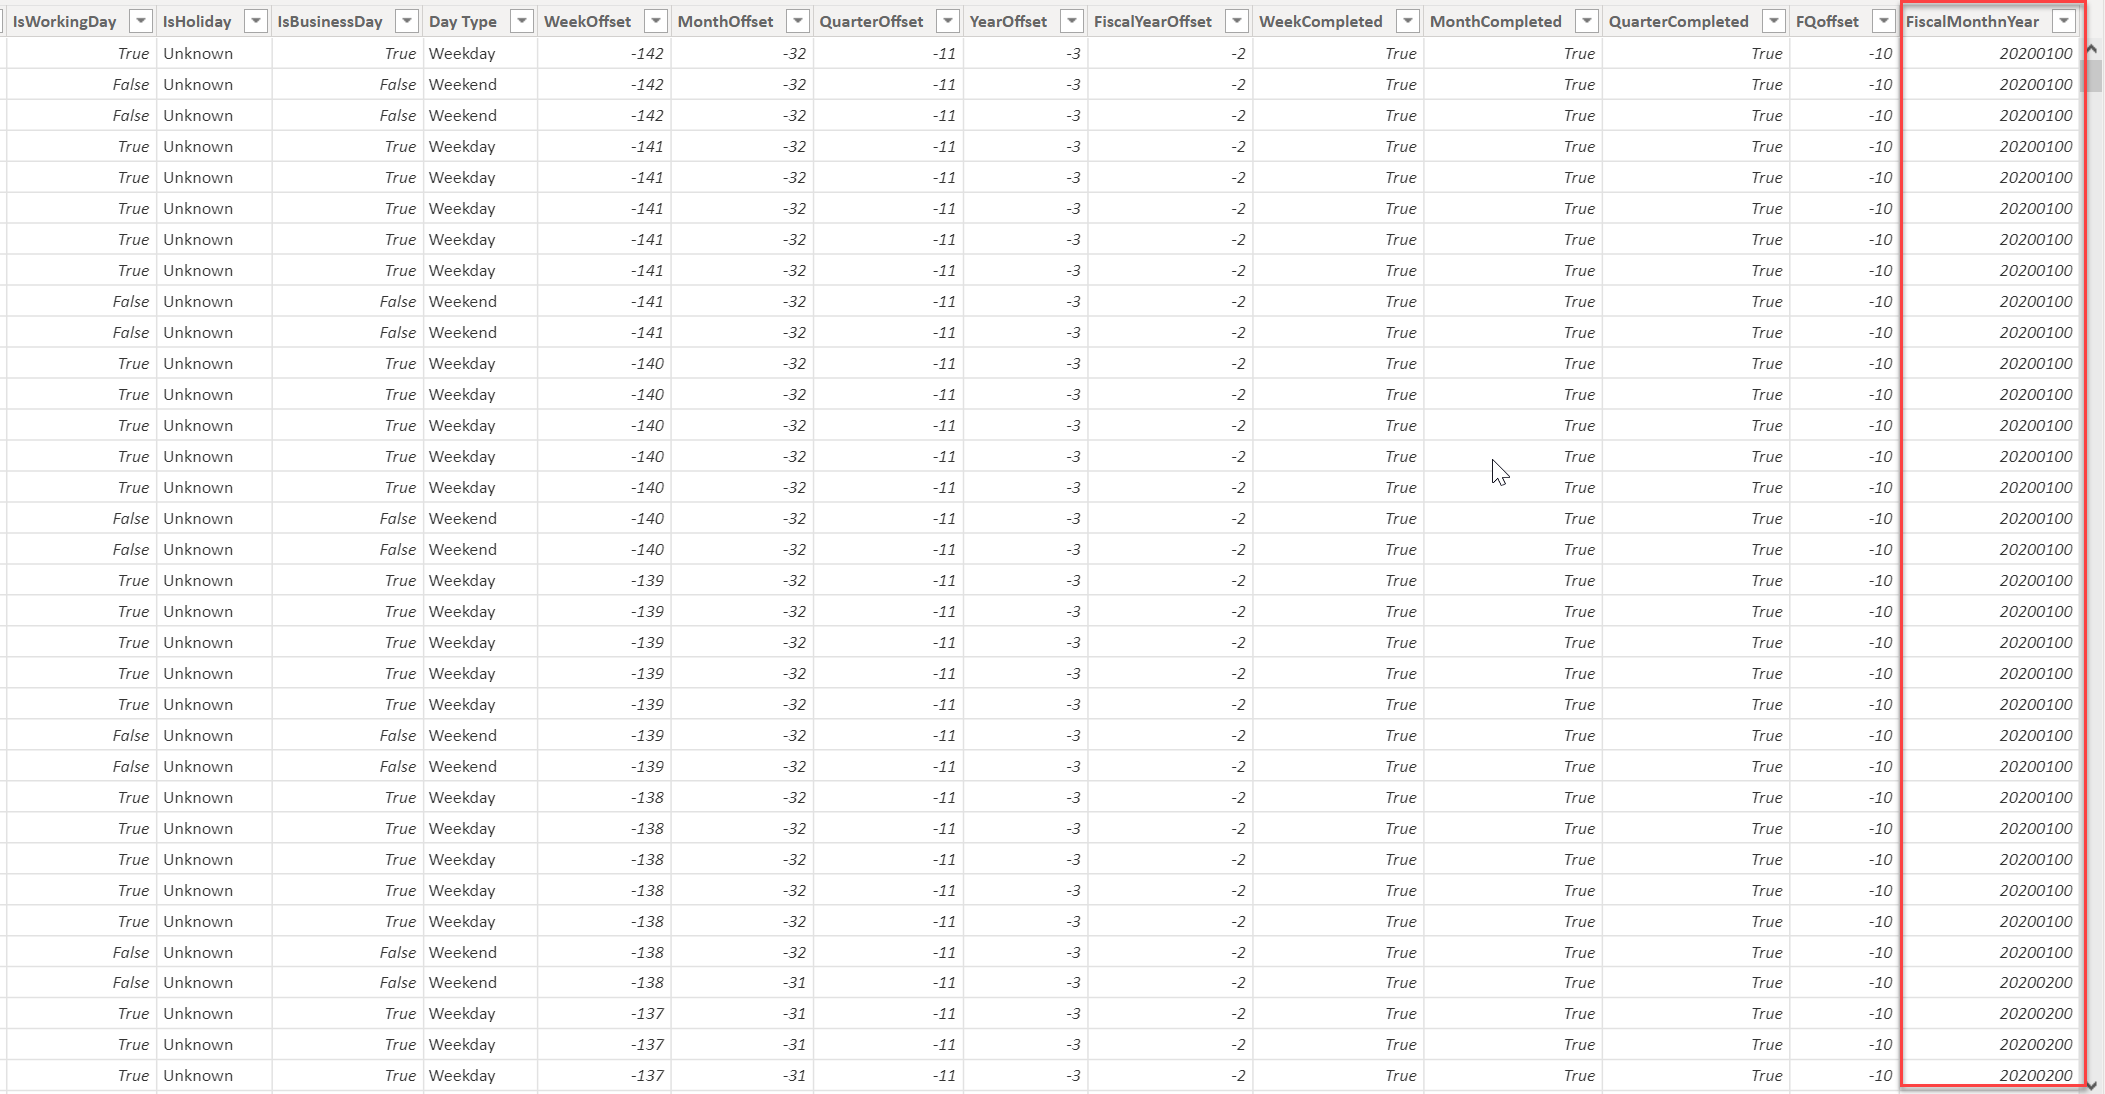
2). In the second step, you’ll be required to create a calculated column of “FiscalMonthnYear”. Below is the DAX formula alongwith the screenshot of the calculated column provided -
FiscalMonthnYear =
VAR _Fiscal_Month_Number =
SWITCH( TRUE() ,
    Dates[MonthOfYear] = 11 , "01" ,
    Dates[MonthOfYear] = 12 , "02" ,
    Dates[MonthOfYear] = 1 , "03" ,
    Dates[MonthOfYear] = 2 , "04" ,
    Dates[MonthOfYear] = 3 , "05" ,
    Dates[MonthOfYear] = 4 , "06" ,
    Dates[MonthOfYear] = 5 , "07" ,
    Dates[MonthOfYear] = 6 , "08" ,
    Dates[MonthOfYear] = 7 , "09" ,
    Dates[MonthOfYear] = 8 , "10" ,
    Dates[MonthOfYear] = 9 , "11" ,
    Dates[MonthOfYear] = 10 , "12" )

VAR _Fiscal_Year =
LEFT( Dates[FQ in FY] , 4 )

VAR _Results =
VALUE( _Fiscal_Year & _Fiscal_Month_Number & "00" )

RETURN
_Results
3). Now, we’ll create the measures to achieve the results. Below are the measures provided -
CQ Sales =
VAR _Current_Quarter =
CALCULATE( MAX( Dates[FiscalMonthnYear] ) ,
    ALLEXCEPT( Dates , Dates[FQ in FY] ) ,
    VALUES( Dates[FQ in FY] ) )

VAR _Last_Sales_Date =
CALCULATE( LASTDATE( Sheet1[Date Column] ) ,
    ALL( Sheet1 ) )

VAR _Sales_On_Last_Date =
CALCULATE( [Total Spend] ,
    FILTER( Dates ,
        Dates[Date] = _Last_Sales_Date ) )

VAR _Current_Quarter_Sales =
CALCULATE( [Total Spend] ,
    FILTER( Dates ,
        Dates[FiscalMonthnYear] = _Current_Quarter ) )

RETURN
_Current_Quarter_Sales + _Sales_On_Last_Date
LQ Sales =
VAR _Last_Sales_Date =
CALCULATE( LASTDATE( Sheet1[Date Column] ) ,
    ALL( Sheet1 ) )

VAR _Last_1_Month_Sales =
CALCULATE( [CQ Sales] ,
    DATEADD( Dates[Date] , -1 , MONTH ) )

VAR _Last_2_Months_Sales =
CALCULATE( [CQ Sales] ,
    DATEADD( Dates[Date] , -2 , MONTH ) )

VAR _Last_3_Months_Sales =
CALCULATE( [CQ Sales] ,
    DATEADD( Dates[Date] , -3 , MONTH ) )

VAR _Results =
SWITCH( TRUE() ,
    MIN( Dates[Date] ) > _Last_Sales_Date , BLANK() ,

    MIN( Dates[Date] ) = _Last_Sales_Date && MONTH( _Last_Sales_Date ) = 11 , _Last_1_Month_Sales ,
    MIN( Dates[Date] ) = _Last_Sales_Date && MONTH( _Last_Sales_Date ) = 12 , _Last_2_Months_Sales ,
    MIN( Dates[Date] ) = _Last_Sales_Date && MONTH( _Last_Sales_Date ) = 1 , _Last_3_Months_Sales ,

    MIN( Dates[Date] ) = _Last_Sales_Date && MONTH( _Last_Sales_Date ) = 2 , _Last_1_Month_Sales ,
    MIN( Dates[Date] ) = _Last_Sales_Date && MONTH( _Last_Sales_Date ) = 3 , _Last_2_Months_Sales ,
    MIN( Dates[Date] ) = _Last_Sales_Date && MONTH( _Last_Sales_Date ) = 4 , _Last_3_Months_Sales ,


    MIN( Dates[Date] ) = _Last_Sales_Date && MONTH( _Last_Sales_Date ) = 5 , _Last_1_Month_Sales ,
    MIN( Dates[Date] ) = _Last_Sales_Date && MONTH( _Last_Sales_Date ) = 6 , _Last_2_Months_Sales ,
    MIN( Dates[Date] ) = _Last_Sales_Date && MONTH( _Last_Sales_Date ) = 7 , _Last_3_Months_Sales ,

    MIN( Dates[Date] ) = _Last_Sales_Date && MONTH( _Last_Sales_Date ) = 8 , _Last_1_Month_Sales ,
    MIN( Dates[Date] ) = _Last_Sales_Date && MONTH( _Last_Sales_Date ) = 9 , _Last_2_Months_Sales ,
    MIN( Dates[Date] ) = _Last_Sales_Date && MONTH( _Last_Sales_Date ) = 10 , _Last_3_Months_Sales ,

_Last_3_Months_Sales )

RETURN
_Results
4). Finally, after writing the above measures we’ll be able to see the individual line item results but figures at Grand Total level will be incorrect. So finally, we’ll write two small measures for each of them just to fix the totals. Below are the measures provided -
CQ Sales - Totals =
SUMX(
    ADDCOLUMNS(
        SUMMARIZE(
            Dates ,
            Dates[FQ in FY] ,
            Dates[Month & Year] ) ,
        "@Totals" ,
        [CQ Sales] ) ,
    [@Totals] )
LQ Sales - Totals =
SUMX(
    ADDCOLUMNS(
        SUMMARIZE(
            Dates ,
            Dates[FQ in FY] ,
            Dates[Month & Year] ) ,
        "@Totals" ,
        [LQ Sales] ) ,
    [@Totals] )
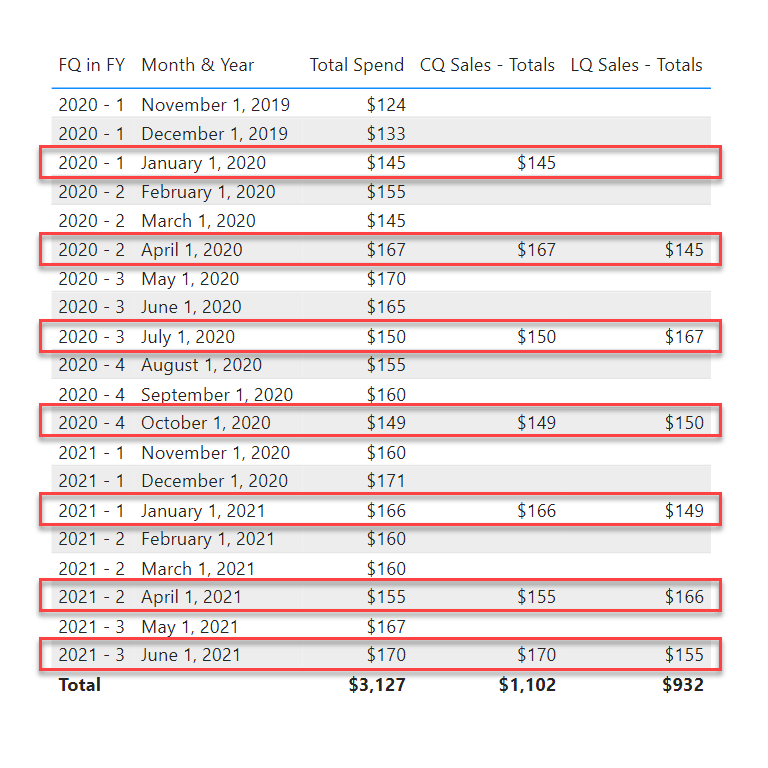
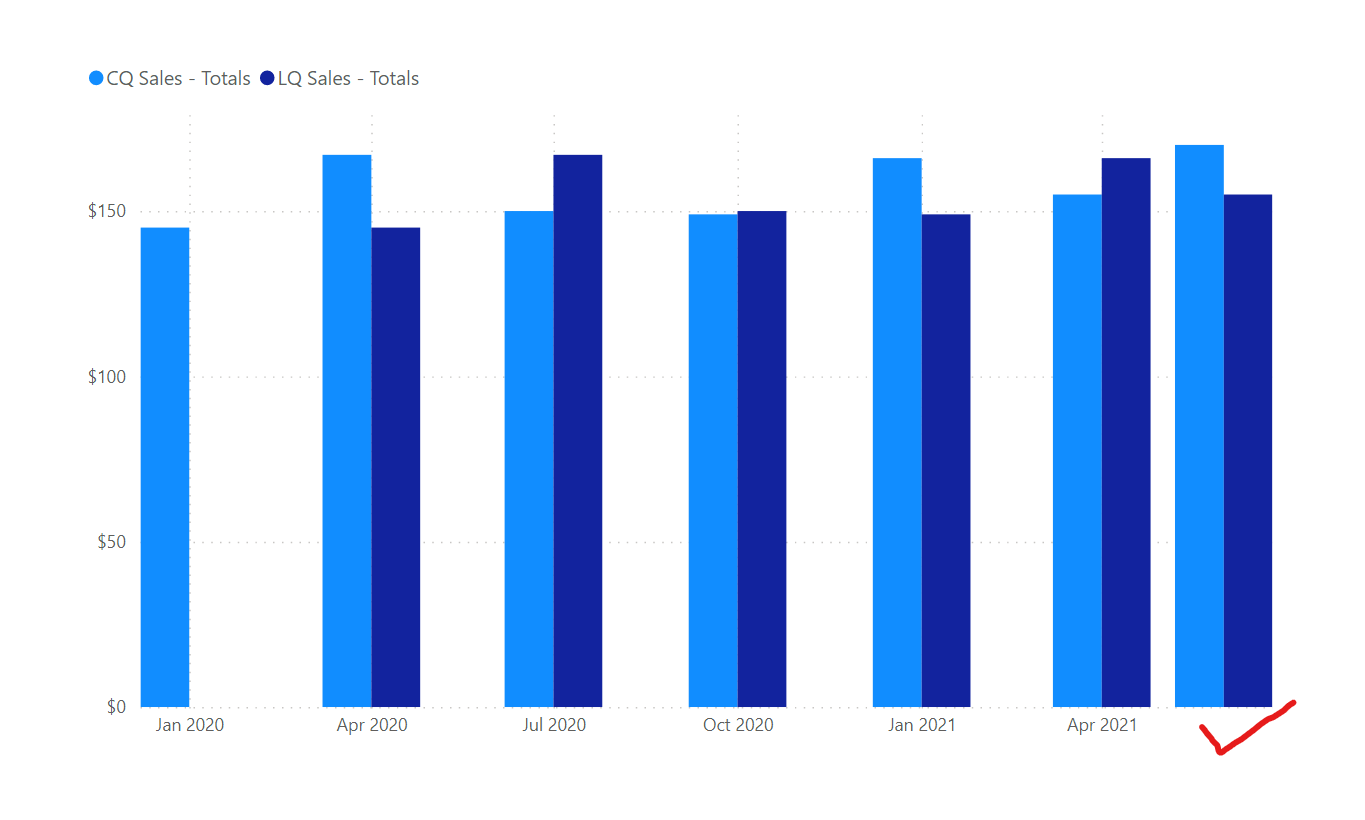
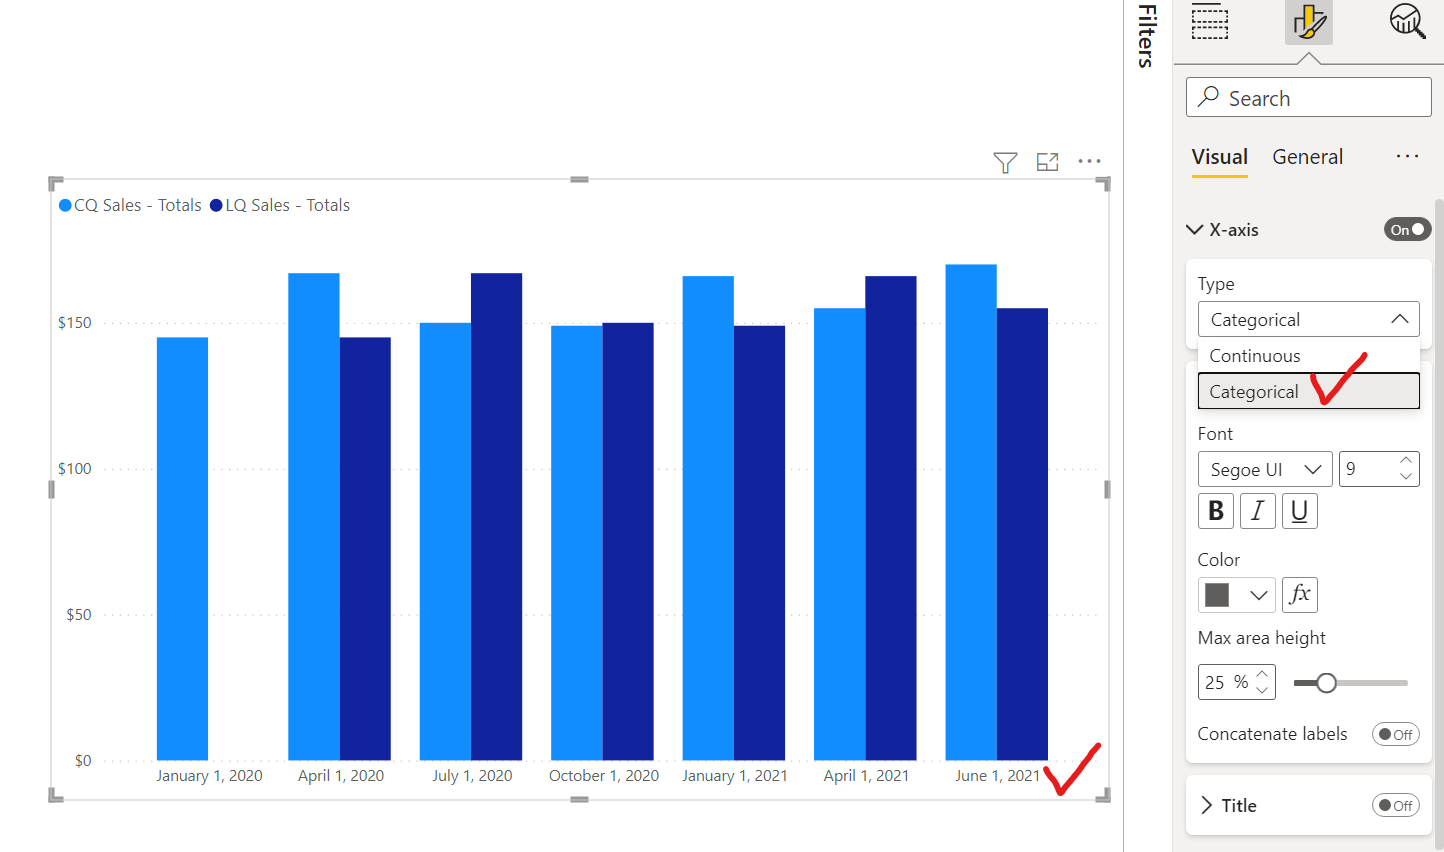
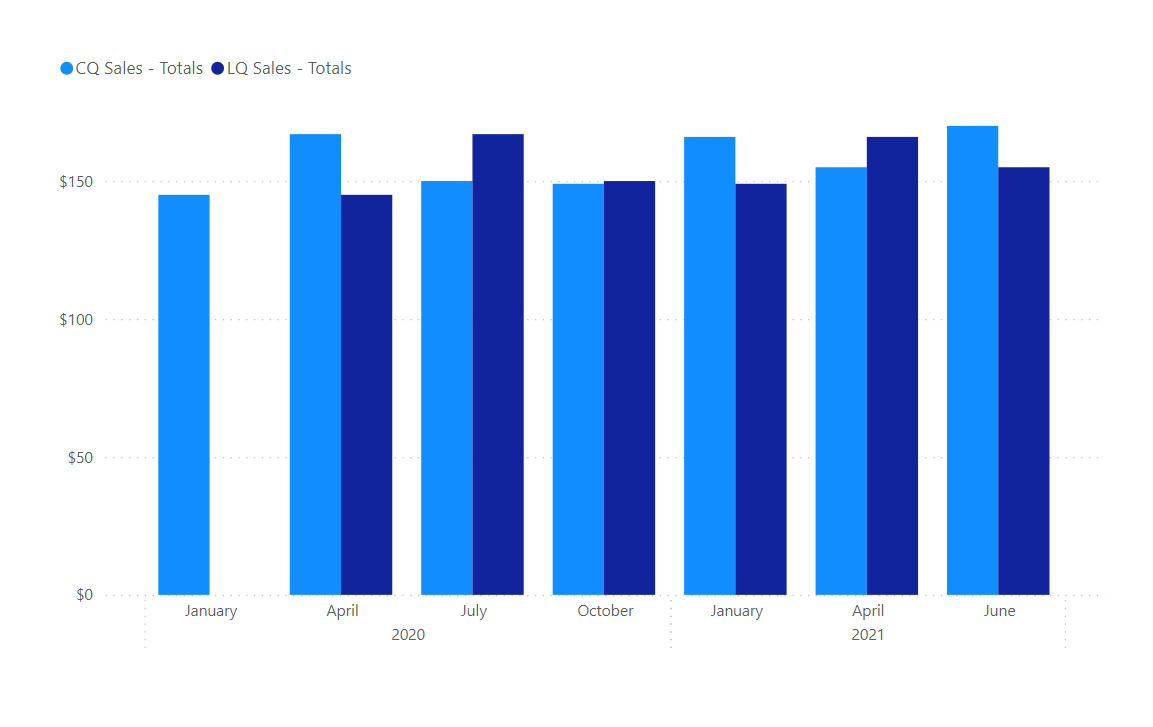
And now, we’ll get the results as expected. Below is the screenshot of the final results provided for the reference -
I’m also attaching the working of the PBIX file for the reference purposes.
Hoping you find this useful and meets your requirements that you’ve been looking for.
Note: I’ve added “Month & Year” field in order to cross-check the results. In case, if you want to remove that field, just adjust the logic of the Totals measure accordingly.
Thanks and Warm Regards,
Harsh
eDNA PCR Quarter - Harsh.pbix (97.4 KB)