Hi,
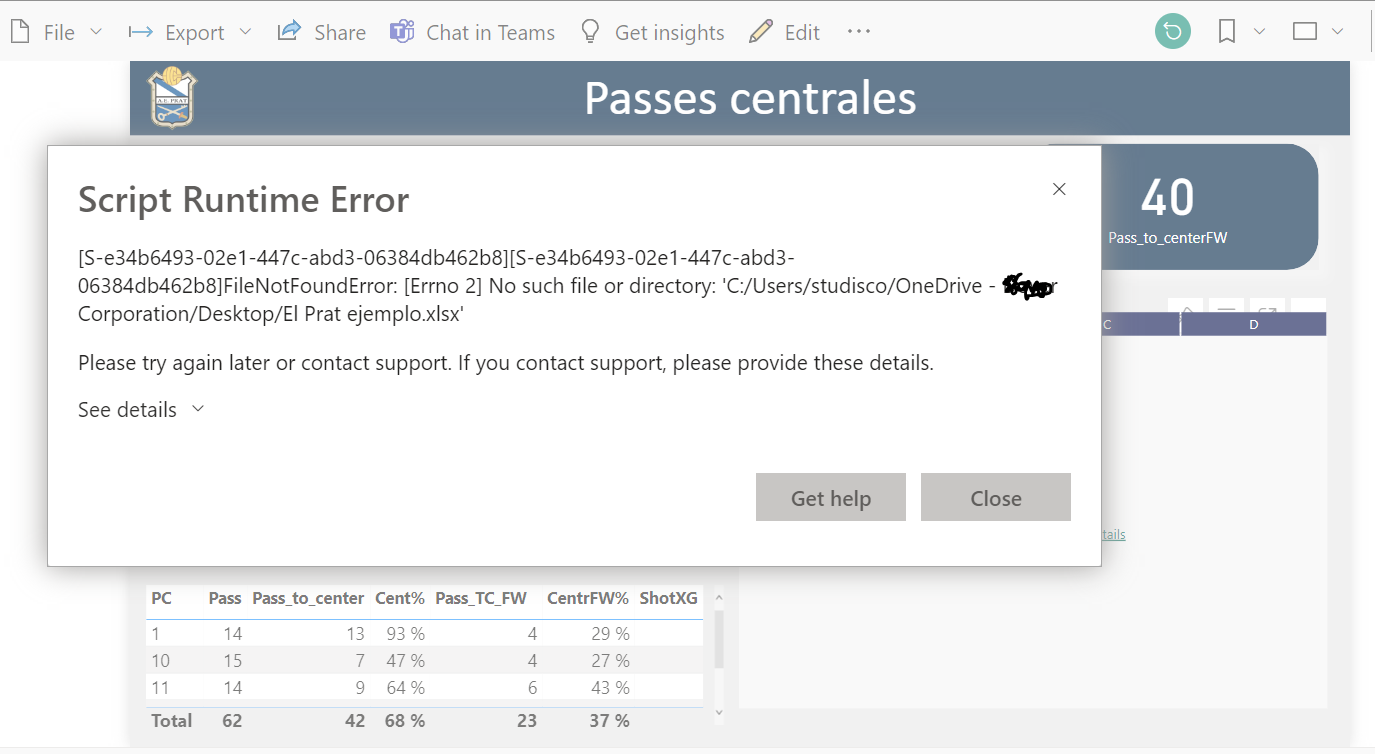
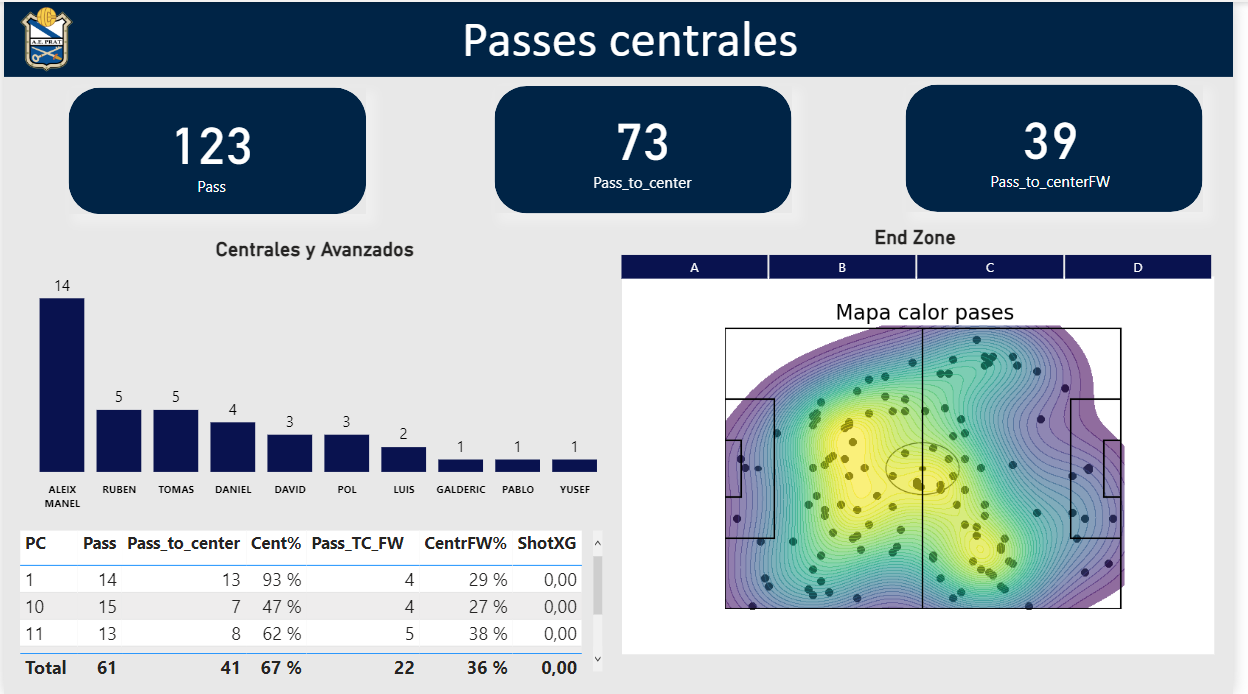
I get an error message when I try to upload my Python visualization in Power B.I. Service.
In Power B.I desktop they are working fine but when uploading them in Power B.I. service I get the attached error message.
Could you please support?
Hi,
I get an error message when I try to upload my Python visualization in Power B.I. Service.
In Power B.I desktop they are working fine but when uploading them in Power B.I. service I get the attached error message.
Could you please support?
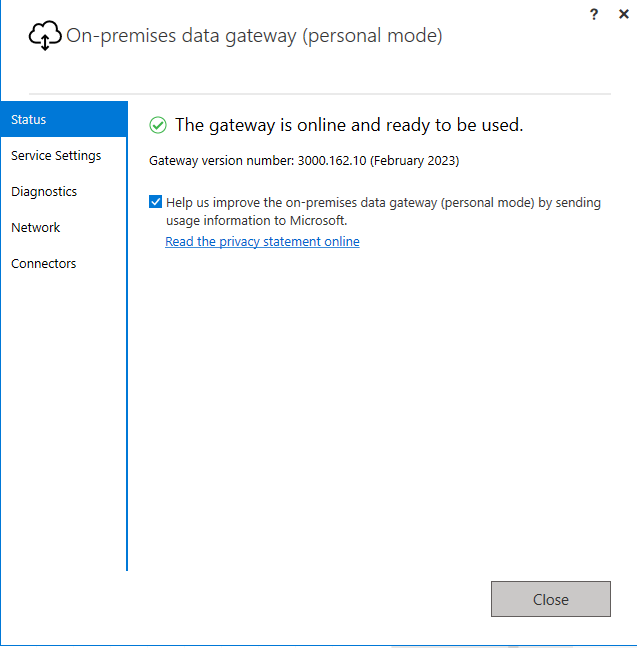
@studisco install gateway in personal mode, then only Python will work in service.
Hello @studisco
Did the responses above help solve your query?
If not, can you let us know where you’re stuck and what additional assistance you need?
If it did, please mark the answer as the SOLUTION by clicking the three dots beside Reply and then tick the check box beside SOLUTION
Thank you
Hello @studisco
Just following up if the response above help you solve your inquiry.
If it did, please mark his answer as the SOLUTION.
We’ve noticed that no response was received from you on the post above. In case there won’t be any activity on it in the next few days, we’ll be tagging this post as Solved.
Hi @studisco
Due to inactivity, a response on this post has been tagged as “Solution”.
If you have a follow question or concern related to this topic, please remove the Solution tag first by clicking the three dots beside Reply and then untick the check box.
We request you to kindly take time to answer the Enterprise DNA Forum User Experience Survey,.
We hope you’ll give your insights on how we can further improve the Support forum. Thanks!
Sorry to come back late on this @AntrikshSharma - I have followed your steps but still have issues to see the visualizations.
Installed the gateway
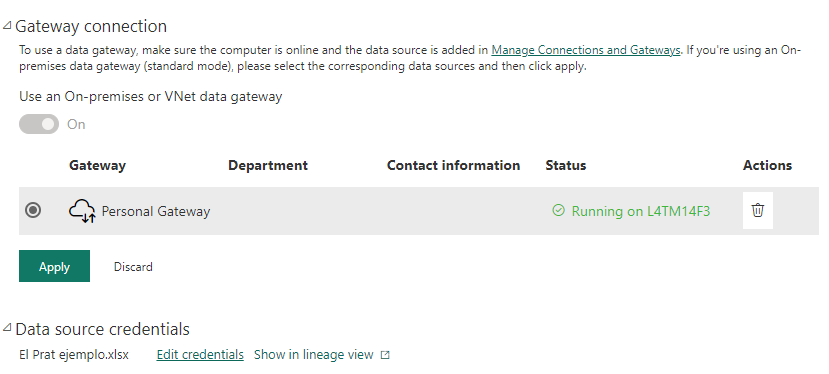
Connected to Dataset
Could you please support?
Thanks
Hi @studisco,
I found that you posted the same question on a new thread. I’ll be closing this thread so that our experts and other members will only be referring to one question - the new thread. hopefully this time we get a solution to your inquiry.
Thank you!
Hi @AntrikshSharma,
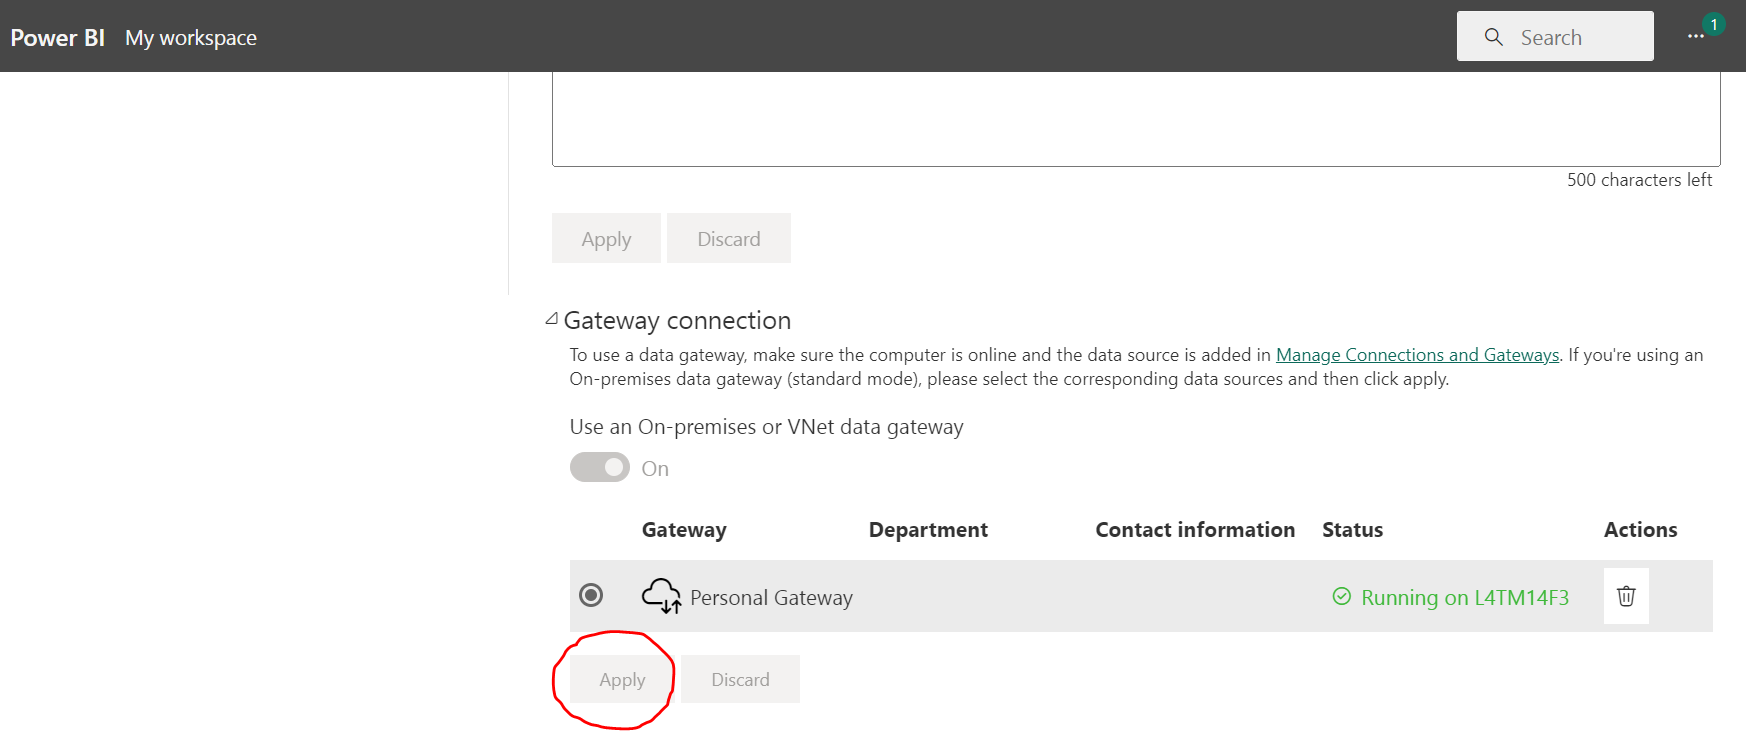
I selected apply but unfortunately the issue is not solved - what can I do next?
Thank you for your help
Kind egards
@studisco Now the issue remains in the python code itself, if the code and environment is correct it should work in service.
Hi @AntrikshSharma,
Thanks for your reply.
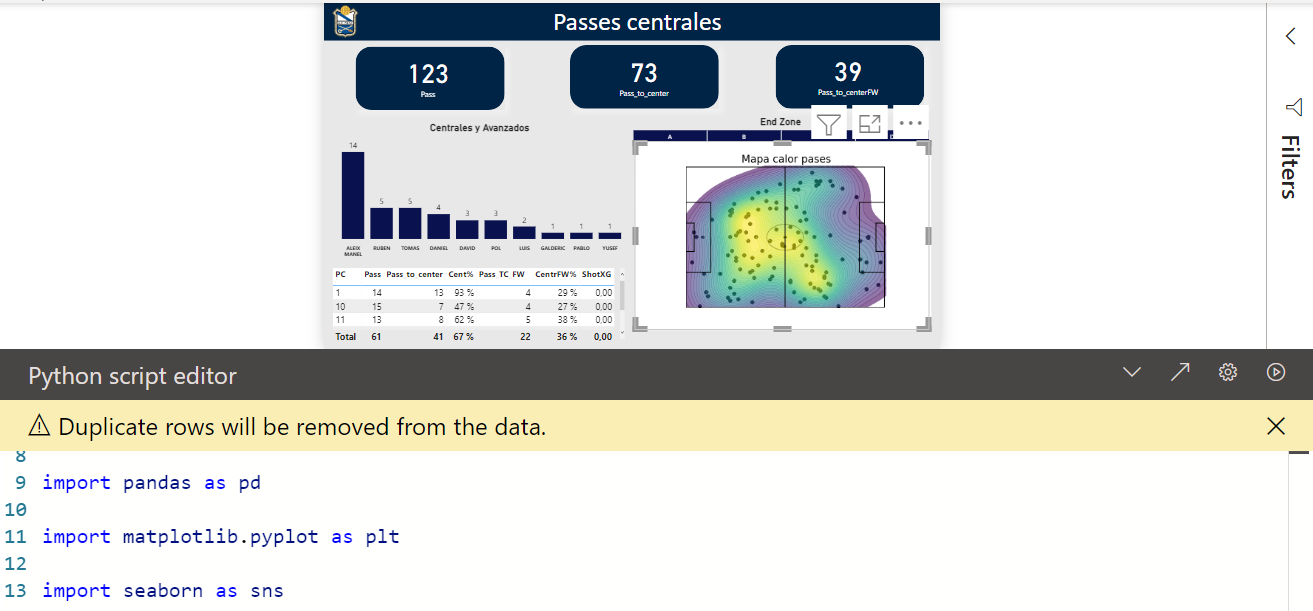
But the Python code is working on Power B.I. desktop and the visualizations are correctly showing up - what else could it be?
Here is the python code:
import pandas as pd

import matplotlib.pyplot as plt

import seaborn as sns

#Create figure
fig=plt.figure()
fig.set_size_inches(7, 5)
ax=fig.add_subplot(1,1,1)
plt.axis('off')
#Pitch Outline & Centre Line
plt.plot([0,0],[0,99], color="black")
plt.plot([0,99],[99,99], color="black")
plt.plot([99,99],[99,0], color="black")
plt.plot([99,0],[0,0], color="black")
plt.plot([49.5,49.5],[0,99], color="black")

#Left Penalty Area
plt.plot([12.5,12.5],[74,25],color="black")
plt.plot([0,12.5],[74,74],color="black")
plt.plot([12.5,0],[25,25],color="black")

#Right Penalty Area
plt.plot([99,86.5,],[74,74],color="black")
plt.plot([86.5,86.5],[74,25],color="black")
plt.plot([86.5,99],[25,25],color="black")

#Left 6-yard Box
plt.plot([0,4.1],[59.4,59.4],color="black")
plt.plot([4.1,4.1],[59.4,39.6],color="black")
plt.plot([0,4.1],[39.6,39.6],color="black")

#Right 6-yard Box
plt.plot([99,94.9],[59.4,59.4],color="black")
plt.plot([94.9,94.9],[59.4,39.6],color="black")
plt.plot([94.9,99],[39.6,39.6],color="black")

#Prepare Circles
centreCircle = plt.Circle((49.5,49.5),9.15,color="black",fill=False)
centreSpot = plt.Circle((49.5,49.5),0.8,color="black")
leftPenSpot = plt.Circle((8.4,49.5),0.8,color="black")
rightPenSpot = plt.Circle((90.6,49.5),0.8,color="black")

#Draw Circles
ax.add_patch(centreCircle)
ax.add_patch(centreSpot)
ax.add_patch(leftPenSpot)
ax.add_patch(rightPenSpot)

df_origin= pd.read_excel("Path",'Final', index_col=None,)

Event = ['Pas']

df=df_origin[df_origin.Event.isin(Event)]

df=dataset

for x in range(len(df["B_Endx"])):
        plt.scatter(df['B_Endx'],df['B_Endy'],color='black')

kde = sns.kdeplot( x =df['B_Endx'], y= df['B_Endy'],color = 'red',shade = True,alpha=.6,n_levels=40, cmap='viridis')

plt.xlim(0,100)
plt.ylim(0,100)

plt.title('Mapa calor pases',color='black',size=20)

plt.show()