In my business we receive referrals from medical networks. Those referrals then go on to have various visits. In the assumptions tab, I have a plug for average visits for each referral category. In addition, I have outlined the timing of those referrals.
What I need to determine is a way to project future month visits based on prior and current month referrals.
This should be a fun analysis to piece together. I have hit a wall with the analysis.
@msedlak It seems like a good scenario to work with but I need some clarification on the concepts. In Excel file it is mentioned Visits Non-Surgical 9 and then if referral date start date is 1/2/20 and it is non-surgical, the # of visits will be 4.5 in period 1 and 2.25 in Period.
What’s the rationale behind 4.5 & 2.25 visits in different periods?
It would be helpful if you could pick one customer from the excel and perform the mock-up of your result so we can better understand how to approach the problem.
Indeed, I agree with Mudassir. More input is needed.
=> How do you map the referrals to periods? E.g. if a patient has 3 referalls on 1/2/2020, how do you know if those visits will be in period 1 or period 2?
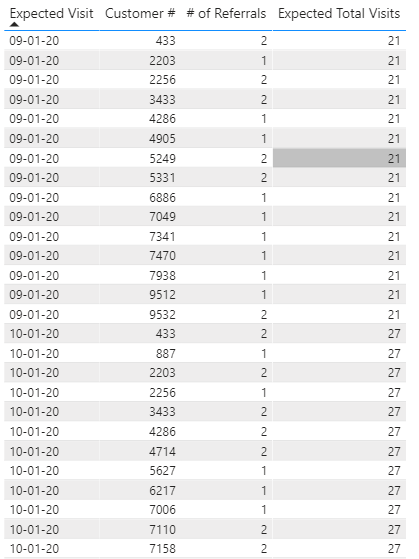
The next step from your table would be taking the referrals that come in and building a date table where the visits land on the projected day based on the Avg Days Between Visits.
For example Customer #4714 has 2 referrals on 1/10/20, on 1/17/20 there would be 2 visits associated with these 2 referrals and then another 2 visits on 1/24/20, and so on.
This is the trick that I was not able to solve for, how do I take the referrals that come in and fill in a separate date table where the visits land on the projected day, but stop after 9 visit avg/referral is hit.
Hi @msedlak , we’ve noticed that no response has been received from you since the 16th of December. We just want to check if you still need further help with this post? In case there won’t be any activity on it in the next few days, we’ll be tagging this post as Solved. If you have a follow question or concern related to this topic, please remove the Solution tag first by clicking the three dots beside Reply and then untick the checkbox. Thanks!
@msedlak I am really sorry. Your post was lost somewhere among all the posts and I didn’t get the chance to look at this. It’s a general message you get and you don’t need to close it unless you have the solution.
@MudassirAli Please don’t apologize. I have not been able to solve this, and I appreciate any help you can offer. I also understand if you don’t have time.
@msedlak It’s a good scenario I will try to solve it myself as I know one member is expert in this kind of scenario. If I can’t solve it, I will pass it on to the other member to have a look at it.
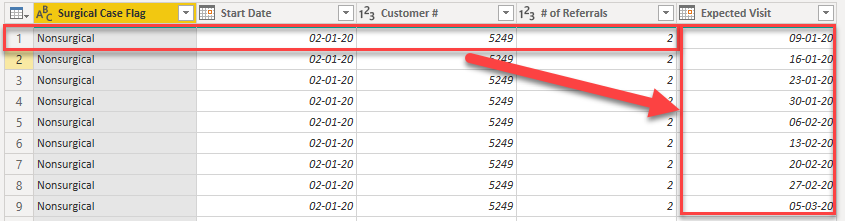
I created a list of dates for expected next visits based on your given variables:
AvgDays = 7 and AvgNumVisits = 9, you can adjust that should this need ever arise.
CreateDates = Table.AddColumn(RemoveBlanks, "Expected Visit", each
    let
        AvgDays = 7,
        AvgNumVisits = 9,
        FromDate = Date.AddDays( [Start Date], AvgDays),
        Source = List.Generate(
                () => [x = 0, y = FromDate],
                each [x] < AvgNumVisits,
                each [x = [x] + 1, y = Date.AddDays( [y], AvgDays)]
            ),
        CreateTable = Table.FromRecords(Source)
    in
        try CreateTable[y] otherwise {}
    )
.
This means that every single record, is filled down for 9 Expected Visits.
Note that if you add the xlsx filepath to FileLocation Parameter and update the ‘current’ selection all queries will be restored. I hope this is helpful.
Hi @msedlak, did the response provided by @Melissa help you solve your query? If not, how far did you get and what kind of help you need further? If yes, kindly mark the thread as solved. Thanks!*