Hi All!
I’m having a bit of difficulty with a specific area of a topic. I’ve seen several examples in the budgeting and forecasting videos, but I’m still having difficulty changing the granularity of the information to make it usable.
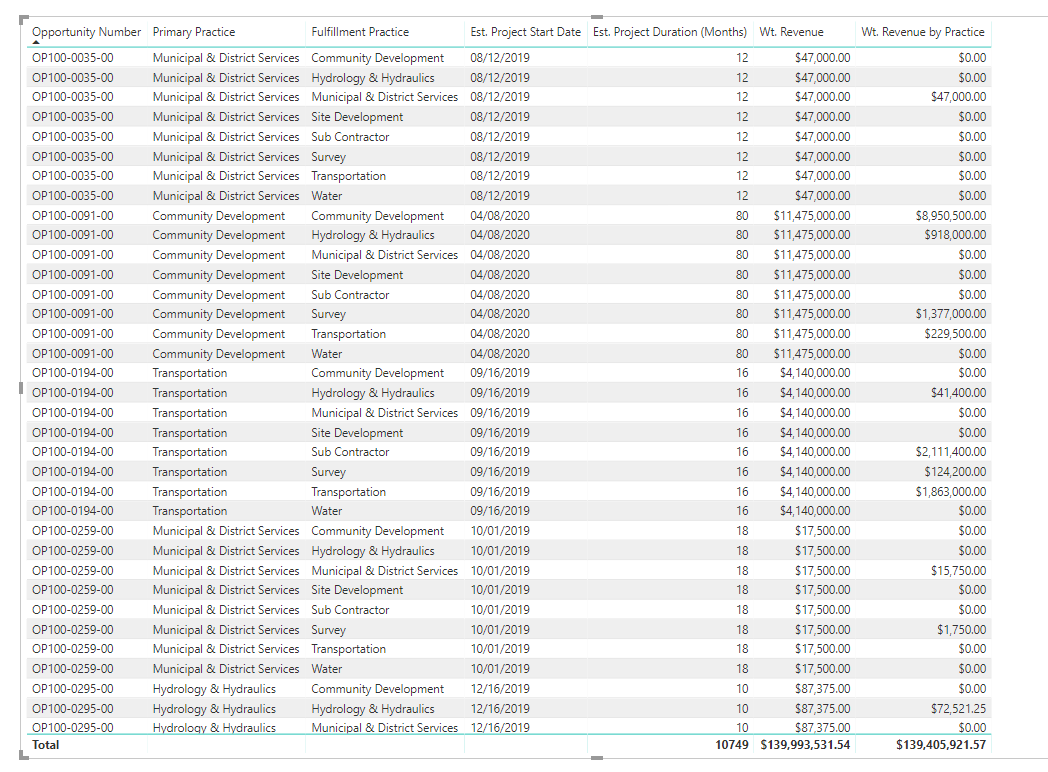
The information we have for projects are total estimated revenue, start date, and duration. I’m trying to calculate monthly revenue for a forecasting model and I need to break down the total estimated project revenue over the period of time of the project. The examples I’ve seen already have budgets assigned to discreet periods of time and I’ve been able to replicate those formulas. The challenge I have is getting my data to a usable granularity to use the measures for the forecast. I’m uncertain if I can perform this within a measure or need to generate a new table.
I believe I will ultimately end up with the following measure:
Budget Allocation =
VAR DaysinContext = COUNTROWS( Dates )
VAR DaysinMonth = CALCULATE( COUNTROWS( Dates ), ALL( Dates ), VALUES( Dates[Month & Year] ))
VAR CurrentMonth = SELECTEDVALUE( Dates[MonthName] )
VAR MonthlyBudgetAmounts = CALCULATE( [Total Budgets], FILTER( ALL( 'Product Budgets'[MonthName] ) , CurrentMonth = 'Product Budgets'[MonthName] ) )

RETURN
IF( OR( HASONEVALUE( Dates[Date] ), HASONEVALUE( Dates[Month & Year] ) ),
DIVIDE( DaysinContext, DaysinMonth, 0 ) * MonthlyBudgetAmounts,
[Total Budgets] )
The part I’m having difficulty with is the Total Budgets portion of the measure to be able to get results.
Thanks for any help you can provide!
Really going to have to see an example here, as it could be many things.
Could be an issue with the data, the data model, the context of the calculation for your visual.
Without all the information it’s difficult to give you a quality solution.
Thanks
Sam
Attached is an example of the model I have set up so far:
Forecast Model.zip (335.4 KB)
Ultimately I am looking to create something similar to the Advanced Budgeting Product Budgeting Analysis. Specifically looking to create a Cumulative Budget vs Actual Results and Monthly Budget vs Actual Results (in the attached example Revenue would be treated the same as Budget).
What I’m struggling with is how to break down the granularity of each opportunity so that it is workable into the respective graphs and tables. What makes it challenging are the start and end dates not coinciding with the start or end of a month, and how to ensure the allocation of the revenue falls between these dates.
Do I need to create a new table where the revenue is allocated on a daily basis? I believe this is the information I’m missing in order to make this model work. While I have attempted to create a table for the revenue, I don’t believe I’ve set up the context correctly, or am missing a connection within my data model.
The table as it is currently written allocates the revenue for each date, but I’m struggling to come up with a filter that limits each opportunity’s daily allocation to its respective start and end date.
Ok let’s simplify this down first.
I can quite clearly see the initial issue here with once fixed should set you off on the right path.
You need to solve this in the model first.
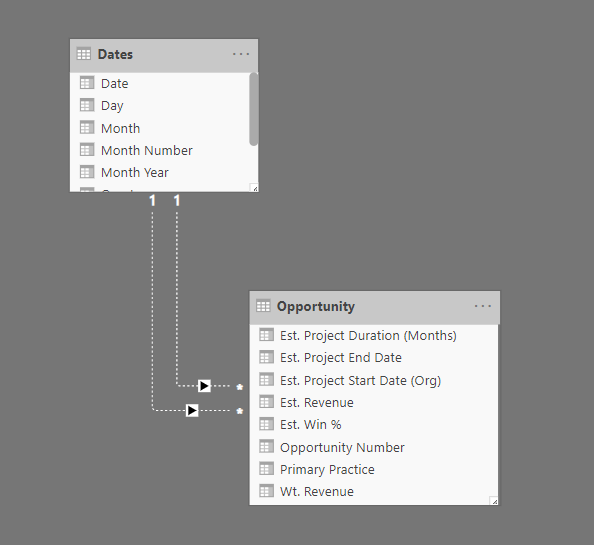
When working with multiple dates in your fact table you need to create inactive relationships between your date column and the fact table…then you solve it with DAX.
See below for an example of this.
Once you have this setup correctly you can find a way to allocate the results across those dates which the project is expected to be open.
First I would add some details here like this.
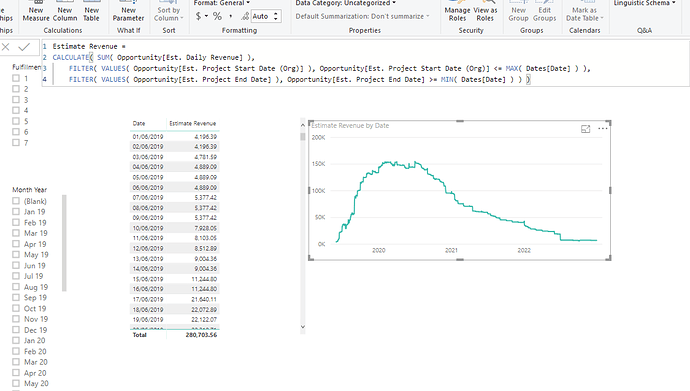
Then create a measure like this.
Estimate Revenue =
CALCULATE( SUM( Opportunity[Est. Daily Revenue] ),
    FILTER( VALUES( Opportunity[Est. Project Start Date (Org)] ), Opportunity[Est. Project Start Date (Org)] <= MAX( Dates[Date] ) ),
    FILTER( VALUES( Opportunity[Est. Project End Date] ), Opportunity[Est. Project End Date] >= MIN( Dates[Date] ) ) )
Now I have a review forecast.
This should solve it for you hopefully.
Thanks
Sam
Thanks to the contributors of this post. Due to the length by which this post has been active, we are tagging it as Solved. For further questions related to this post, please make a new thread.


