I have this Project status data which shows the status of the different projects, the resources available, the different status changes, and stages the process pass through.
What I am looking for:
1.What set metrics I may show for some who wants to understand the status/progress of the project? May be show me some ideas or a couple of sample charts that can provide an insight.
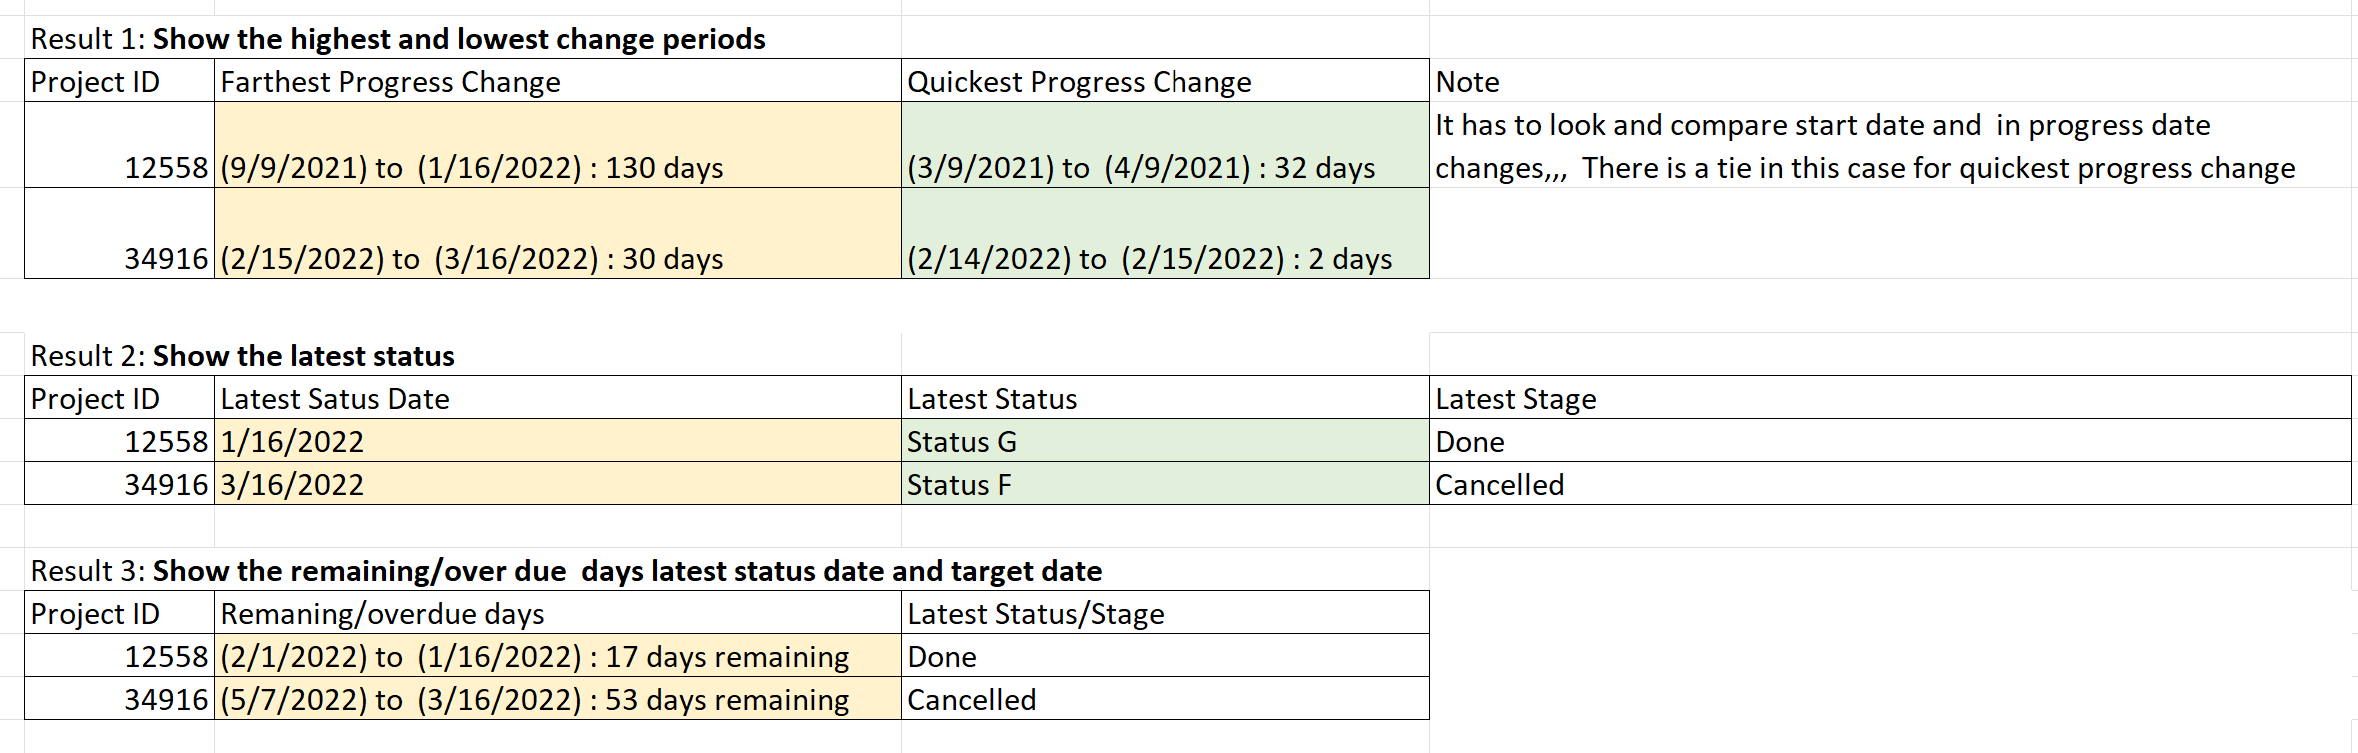
2.Calculate the status changes, probably to show the latest status? or to show the Status change in timeline or to show the highest and lowest change periods?
3.Show the Project risks as per the date changes against the actual project release and estimated completion dates?
please find sample Pbix and sample data.
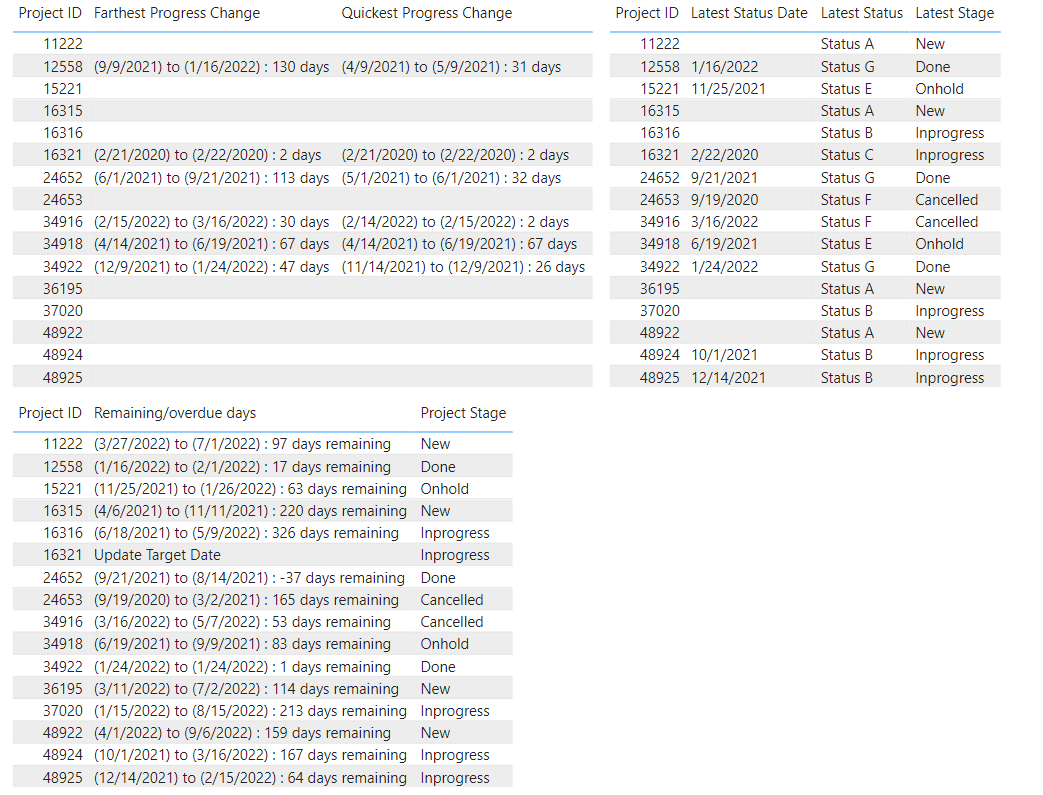
All 3 Result Tables can be generated in Power Query by leveraging GroupBy feature.
To arrive at the Progress change Days, you can use Imke’s solution to retrieve the previous row value.
You can use Table.Max and Table.Min functions to create separate Farthest Progress Change and Quickest Progress Change tables respectively which can be merged to provide you Result 1.
Please find below my solution for your quick reference.