Hi guys,
I’m doing this report above, like Sam taught us, with a supporting table ( https://portal.enterprisedna.co/courses/unique-analytical-scenarios/lectures/11980964).
So far so good, all done, but…
All the lines in this report are measures because we want specific results. Maybe i should add a supporting column on the table, i don’t know.
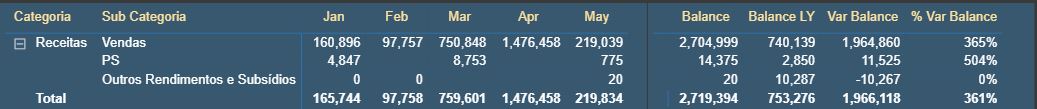
So, it’s a matrix visual and i would like, 4 or 5 more columns for each measure, for LY results and variations as well as budget totals. Like this:
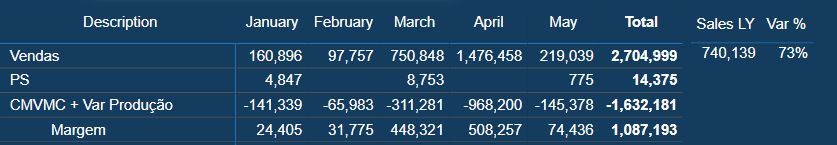
Those 2 columns on the right are from a table visual, but i have to add 3 more columns (3 more measures). And the same for every measure on this P&L for every measure i’ve build. Which means 18 lines on this P&L times 5 columns means 90 measures.
I don’t think this is the way i should do it but can’t think on any other way.
Can you help me?
Thanks a lot everyone
Pedro