Hello everyone,
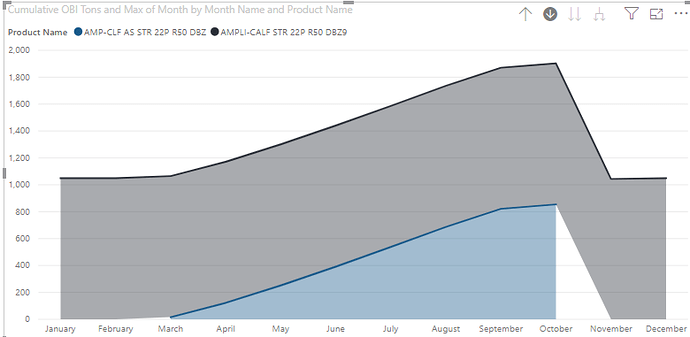
I am attempting to create a product launch tracker for our team. This new product replaces the old product, so the idea is to have a graph where I plot the tonnage for 2018 sales of the old product and next to it have the sales of the new product for 2019, theoretically the volume of the old product goes down and the volume of the new product goes up.
How can I accomplish this?
thank you
Gustavo
Ok going to need far more information to help here, for example what does the data look like that you are dealing with, also what model have you developed.
We really need this information to offer anything of value.
I’m sure after seeing an example of these things and exactly what the scenario looks like it will more than likely be covered someway from content available at Enterprise DNA and you could easily to printed to the technique to use.
Thanks
Sam
Please see an example of the data. The sales are monthly total. Ampli-Calf is the name of the old product and AMP-CLF AS is the name of the new product. I have developed a Calendar table and a Key Measures table where tons, cumulative tons is calculated. I have been able to do this type of plot, and maybe it is okay like this.
the base data is here
Sales.csv (1.3 KB)
like I said maybe it is okay the way that I have, but I feel that I could have done better here. what do you think?
Okay cool so it seems like you’re just working away at some time comparison work here.
This is really perfect for Power BI and can be implemented quite effectively.
I would do a good review of the below concepts and techniques. You will want to know about some simple time intelligence functions, but also how to create a cumulative total. Once you have these and you have your data model set up correctly then to me all of this analysis should flow just very simply.
Also check out the below
Just making absolutely sure your model is correct is important as well. But it seems like you might already be across this which is good. Don’t forget to check out the advanced modelling course as well if you feel like you need to get a bit more understanding around the modelling area.
Sam
Thanks for the reply Sam, the video that you shared here is a great resource for this type of comparison.

