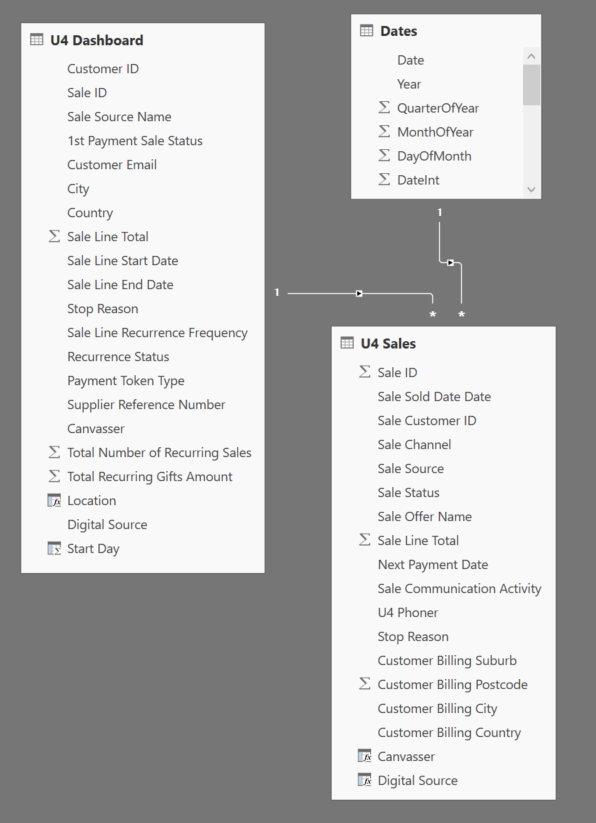
The U4 Dashboard table looks like more of fact table than a dimension table. I’d try to break that out a little more. Happen to be able to upload the pbix file?
you need to work out the primary keys for the dimensions required. The fact tables normally have the dates information. I would suggest the U4 Sales looks like the Control Ledger and the U4 Dashboard would be a sub-ledger of that data set. Which ever table has the unique sale ID should be the master table for the Facts. If a Sale ID is repeated this may be a sub ledger.
Maybe outline which tables are the unique primary keys?
I think I’m trying to run before I can crawl here.
I have three data sets and am not sure how to connect them.
There’s the raw data from the supplier. The supplier gets digital leads and phones them in an attempt to convert them to a monthly gift. The raw data includes all contacts attempted. I know the cost of each digital lead source and the average cost per call.
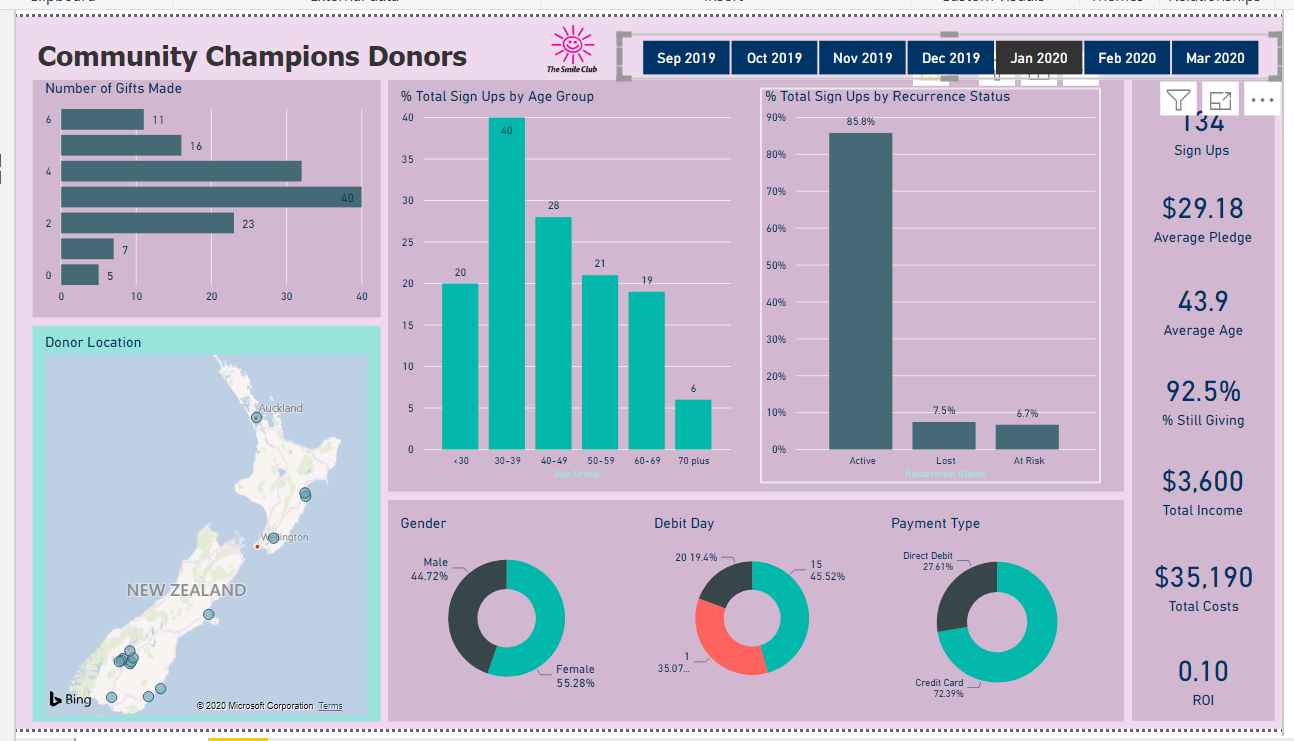
The successful monthly giving plans are then loaded onto our database (that’s the Dashboard table)
The Sales data contains the recurring transactions and any additional one-off transactions we received
Currently the raw data is separate from the other two tables. There is however a unique identifier that connects the raw data to those customers that have been imported into our database. This number is contained in the Dashboards table and the first transaction only of the Sales table.
It would be nice to have all tables connected so the costs flow through etc.
Any additional thoughts would be most appreciated.
In my view all the tables you mentioned above sound like fact tables. So you need to have a think about what would be lookup tables you could setup that would logically connect to these fact tables - for example the Dates table.
Have you gone through this course here? These explains everything you need to know about this area of Power BI
The Recurrence ID is the primary key so the Recurrence table must be a lookup table (?).
However, when I choose a month (based on Start Date in the Recurrence table), neither Average Age, Gender nor Location change to reflect those customers who started that month.
I’m guessing the Dates table not being attached to the Recurrence table is the problem.
I tried making the Recurrence table a fact table but the Dates table wouldn’t connect to it.
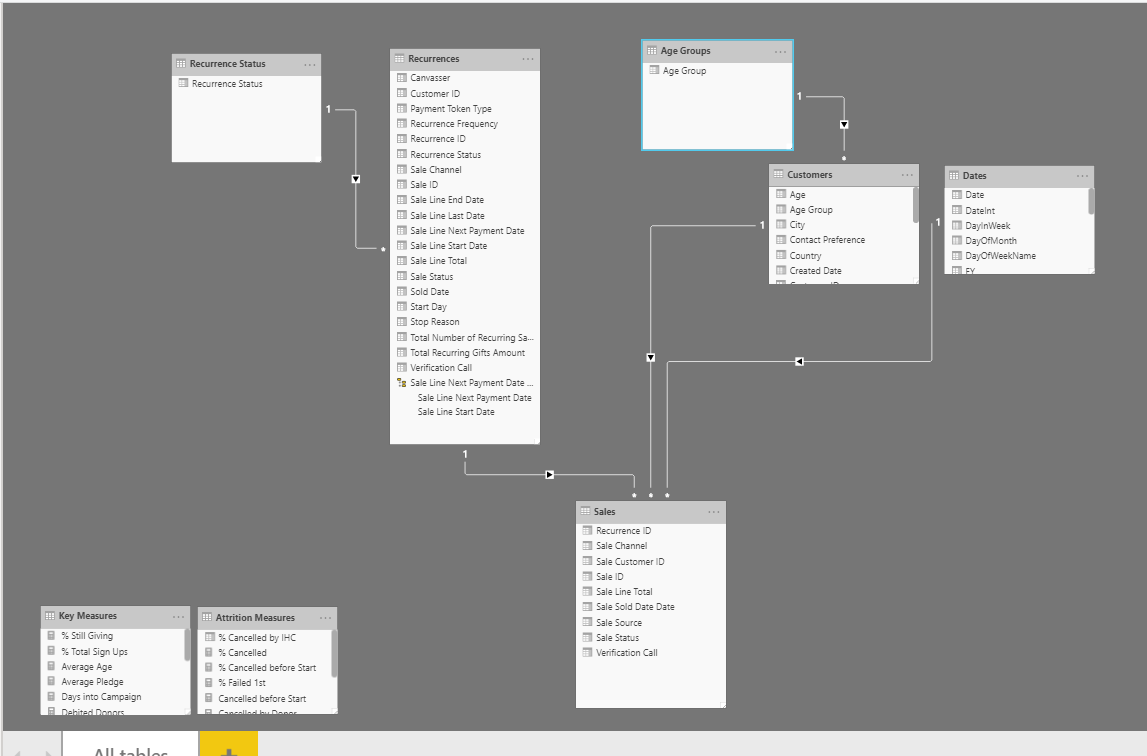
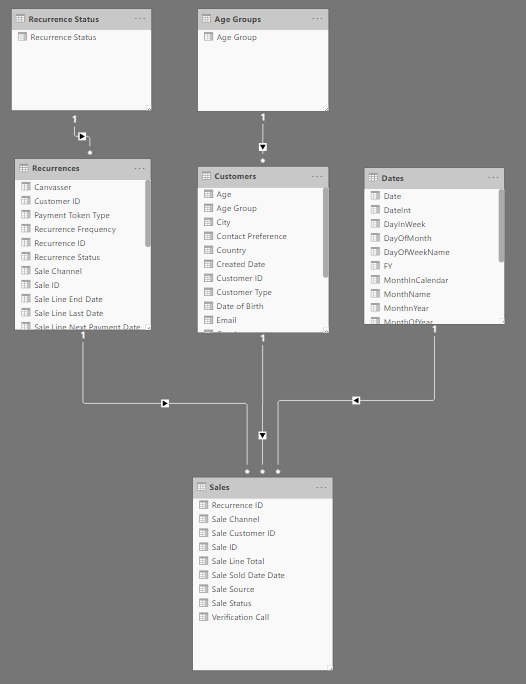
. @KieftyKids let’s start by examining your model. I moved your tables around a bit any didn’t make any chages - this is what it looks like now. IMO there is nothing ‘wrong’ with this model - all tables have One-to-Many relationship flowing down. My only reconmendations would be to:
split the Recurrences table into more dimensions like @sam.mckay suggested.
hide al primary key fields (in report view) on the many side of each relationship and
hide all ‘date’ fields in fact and dimension tables except for the Date dimension table
to prevent mistakes in field selection within the report itself.
Every single DAX calculation relies on relationships and context.
So to resolve the issues you’re facing, you’d have to provide the measures that required relationship.
This doesn’t mean you have to change your model because you can create this relationship virtually within your measures using TREATAS for example.
Another way to deal with this could be to create an inactive relationship between Recurrences and Dates and then ‘activate’ it inside your measure using USERELATIONSHIP. However from a modelling perspective it makes no sense to have a relationship between dimension tables so I’d prefer TREATAS.