Greetings!! EDNA community
I’m using below code from course Solving Analytical Scenarios w/Power BI & DAX Chapter Sales and Orders in progress and couldn’t understand how it is returning rows.
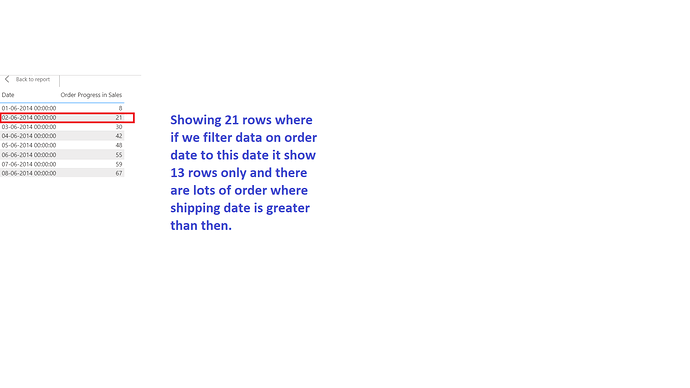
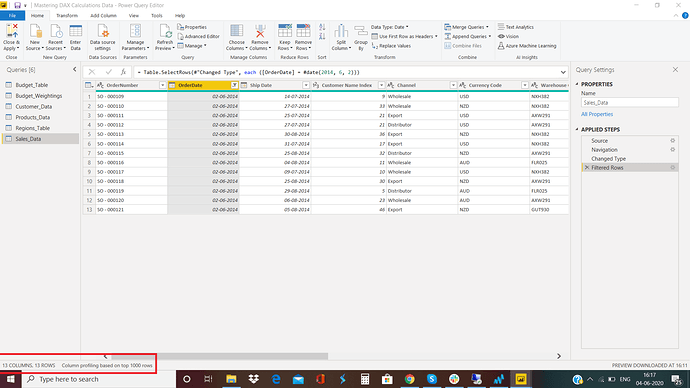
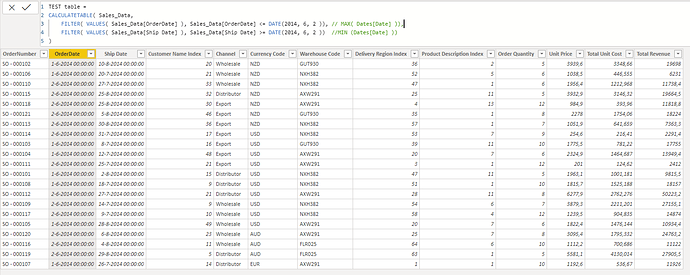
For example this below expression in image 1 its showing 21 rows for date 2/6/14 where if we filter data on order date to this date it show 13 rows only and there are lots of order where shipping date is greater than this date. I believe Max and Min date in expression is the date of row context which is this situation for second row is 2/6/14.
Please help to understand this in details.
Also would like to suggest that please continue explaining in same how formula is working as in Master DAX lecture, this will help is someone coming to course again after gap but can recall with your guidance
DAX Code
Order Progress in Sales =
CALCULATE(COUNTROWS(Sales_Data),
FILTER(VALUES(Sales_Data[OrderDate]),Sales_Data[OrderDate]<=MAX(‘Date’[Date])),
FILTER(VALUES(Sales_Data[Ship Date]),Sales_Data[Ship Date]>=MIN(‘Date’[Date]))
)
Image1
Image2
Thanks,
HarryMastering DAX Calculations Data.pbix (454.3 KB)


