Hi everyone.
I just wanted to take a moment to thank those who reviewed and participated in this week’s DAX problem, Timesheet and Wages.
My solution has been posted to YouTube, but I’ve written-up some the thoughts I had while solving this problem.
Setup:
For both the calculated column and measures pages, I added some basic slicers, a reset slicers bookmark and button, and a table with basic time info
My Solution using Calculated Columns:
For me, my place of comfort is small steps, so I started with the smallest calculation I could; breaking down the daily hours into their regular, overtime, and holiday components.
(I’m verbose coder by nature, and as I don’t approach coding as if I’m writing for myself now, but rather for myself (or whoever will be maintaining the code) in 6 months when I’ve forgotten my train of thought and need to understand and enhance my code, I’ll happily err on the side of readability over performance most of the time. I know this is by no means a performance solution, but in my opinion is very readable and easy to understand.)
So, to get the [Regular Hours], I opened the [Time] table and create a calculated column for [Regular Hours] (using the “CC-” prefix)
CC-Regular Hours =
VAR _Hours = 'Time'[Hours]
VAR _IsHolidayDay = IF( RELATED( Dates[IsHoliday] ) = TRUE(), 1, 0 )
VAR _IsWeekendDay = IF( RELATED( Dates[Day Type] ) = "Weekend", 1, 0 )
VAR _IsRegularDay = IF( _IsHolidayDay + _IsWeekendDay = 0, 1, 0 )
VAR _Result = SWITCH( TRUE(),
_IsHolidayDay = 1, BLANK(),
_IsWeekendDay = 1, BLANK(),
_IsRegularDay = 1, IF( _Hours <= 8, _Hours, 8)
)
RETURN
_Result
- First I grabbed the [Hours] entry and place into a variable
- (I always use an underscore prefix on my DAX variables as I find it makes my code easier to read and also ensures I don’t accidentally choose a column by mistake when using the built-in Intellisense in the DAX editor window)
- (Also, I use the keyboard shortcut of CTRL + the mouse wheel to increase or decrease the font size in the DAX Editor window)
- Next I need to figure out the day type, so I create boolean (1/0) variables to calculate if it’s a holiday, weekend, or regular day
- I can leverage the data model to see if it’s a holiday by checking the related Dates[IsHoliday] value
- I can again leverage the data model to see if it’s a weekend day by checking if the related Dates[Day Type] value is “Weekend”
- From there, it’s a regular day if its not a holiday or weekend; as the “Holiday” and “Weekend” fields are 1/0’s, I can use a simple sum to calculate if it’s a Regular day (a 1/0 as well)
- Now I can calculate my result, using a SWITCH TRUE statement to return
- BLANK’s if it’s a holiday or weekend
- For regular days, if the hours are 8 or less, use the hours, otherwise 8
- Then use RETURN RESULT
- Next, I can use the code from the [Regular Hours] column I just calculated to create another column for the [Overtime Hours]
- I use mostly the exact same code, only changing the RESULT calculation to return BLANK for a holiday, all the hours if it’s a weekend, or the hours over 8 if it’s a regular day
- Finally, I can use the code from the [Regular Hours] column again to create another column for the [Holiday Hours]
- Again, I use mostly the same code, again only changing the RESULT calculation to return the full hours for a holiday and BLANK otherwise
So, now I’ve got my component hours calculated for each day and its time to calculate the associated wages
Now on to a new calculated column for the [Regular Wages]:
CC-Regular Wages =
VAR _Hours = 'Time'[CC-Regular Hours]
VAR _WageType = "Straight Time"
VAR _Rate = RELATED( Employees[Hourly Wage] )
VAR _Multiplier = LOOKUPVALUE( 'Wage Types'[Multiplier], 'Wage Types'[Wage Type], _WageType )
VAR _Result = _Hours * ( _Rate * _Multiplier )

RETURN
_Result
- Again, let’s get the hours, but this time we already have it calculated in our [Regular Hours] calculated column, so lets just use it
- I also set a variable for [Wage Type] to “Straight Time” as I’ll use this later to get the wage multiplier from the disconnected [Wage Types] table
- I can get the employee’s hours rate from the [Employees] table in the data model
- To get the hourly rate multiplier, I need to retrieve the multiplier associated with the wage type, and I can use the LOOKUPVALUE function to get that from the disconnected [Wage Types] table
- Then I calculate the RESULT being the hours x the rate x the multiplier, and finally RETURN RESULT
I can use similar code to calculate the [Weekend Wages] and [Holiday Wages]; so copy-and-paste the [Regular Wages] code and
- For [Overtime Wages], change the [Regular Hours] column to [Overtime Hours] and change “Straight time” to “Time-and-a-half”
- For [Holiday Wages], change the [Regular Hours] column to [Holiday Hours] and change “Straight time” to “Double Time”
So, now I’ve got the component hours and component wages, and I have the total time from the data table, so its time to make a total wages column; this is just a simple sum using the component “wage” columns
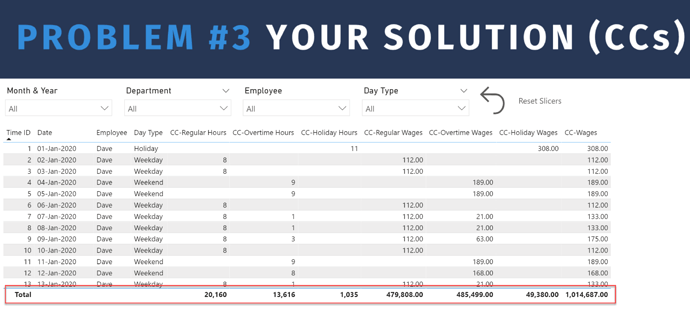
Now, I went back to the CC page, and added these newly-calculated columns into the table:
- Add the [Regular], [Overtime], and [Holiday] hours
- Add the [Regular], [Overtime], and [Holiday] wages
- Finally, add the [Total Wages] column
As you can see, we have TOTAL values for all our calculated columns that are automatically shown in the table visual
Now, lets make a simple bar chart of total wages by department, and use wage type as the legend
(as an aside, when I have 3 categories to show in a chart, I tend to choose the darkest, lightest, and a medium colour for better contrast).
My Solution using Measures:
I followed the same basic pattern that I used for the calculated column solution, namely I calculated the component hours, and then use these to calculate the component wages, and then finally use simple sums to get the totals.
So, for regular hours, I copied the code from the [CC-Regular Hours] column of the [Time] table, but as I’m now not in the [Time] table, I can’t use the [Hours] column directly so I used SELECTEDVALUE; other than that, the formula is the same.
M-Regular Hours =
VAR _Hours = SELECTEDVALUE( 'Time'[Hours] )
VAR _IsHolidayDay = IF( SELECTEDVALUE( Dates[IsHoliday] ) = TRUE(), 1, 0 )
VAR _IsWeekendDay = IF( SELECTEDVALUE( Dates[Day Type] ) = "Weekend", 1, 0 )
VAR _IsRegularDay = IF( _IsHolidayDay + _IsWeekendDay = 0, 1, 0 )
VAR _Result = SWITCH( TRUE(),
    _IsHolidayDay = 1, BLANK(),
    _IsWeekendDay = 1, BLANK(),
    _IsRegularDay = 1, IF( _Hours <= 8, _Hours, 8)
)

RETURN
_Result
I then did things the same way for the [Overtime Hours] and [Holiday Hours] measures.
Again leveraging what I’d already done in the calculated columns solution, I copied the 3 wage calculations and changed the direct reference to the associated [Hours] column. Then I used the measures I just calculated. Also, I couldn’t use the RELATED function as I’m no longer editing the table directly, so I used the SELECTEDVALUE function instead to get the employee’s hourly wage.
M-Regular Wages =
VAR _Hours = [M-Regular Hours]
VAR _WageType = "Straight Time"
VAR _Rate = SELECTEDVALUE( Employees[Hourly Wage] )
VAR _Multiplier = LOOKUPVALUE( 'Wage Types'[Multiplier], 'Wage Types'[Wage Type], _WageType )
VAR _Result = _Hours * ( _Rate * _Multiplier )

RETURN
_Result
Once again, I can then do things the same way for the [Overtime Wages] and [Holiday Wages] measures.
So, as I did for the calculated columns solution, and now that I have the component hours and component wages measures, I made [Total Hours] and [Total Wages] measures, again using a simple sum and using the component “hours” and “wages” measures.
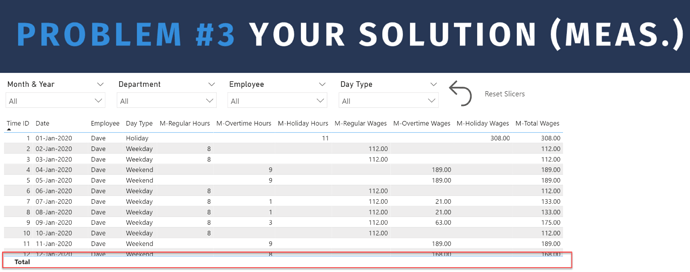
Then, I added these new measures into the table on the [Measures] page.
- Add the [Regular], [Overtime], and [Holiday] hours measures
- Add the [Regular], [Overtime], and [Holiday] wages measures
- Add the [Total Hours] and [Total Wages] measures
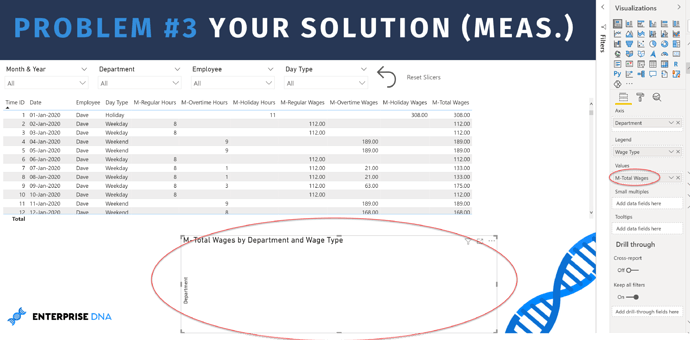
Here we see a difference between the two solutions: with the calculated column solution, we implicitly got total values, whereas there are no totals for the measures solution.
Similarly, when we use our same measures in a simple bar chart, nothing is shown.
This brings us to one of the most important “features” of Power BI visuals, in that one must pay particular attention to the totals when using measures. Virtual tables can be used in the DAX code of our measures to handle this situation. We can use the FIX INCORRECT TOTALS pattern post described on the Enterprise DNA forum.
So I created some new measures for the totals, and I prefixed these with “M2-”. So, for the [Total Hours], I first constructed a virtual table using SUMMARIZE to mimic the physical table in our visual. Then I used the SUMX iterator to sum over our virtual table.
M2-Total Hours =
// construct virtual table to mimic the physical table
VAR _vTable = SUMMARIZE( 'Time','Time'[Time ID],'Time'[Hours] )
// sum the virtual table
VAR _Result = SUMX( _vTable, 'Time'[Hours] )

RETURN
_Result
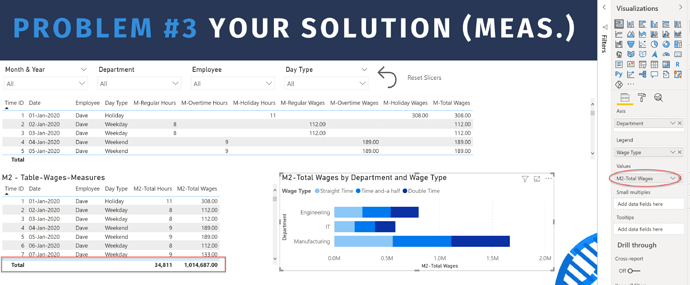
I then made a copy of our the first measures table, removed all the existing measure columns, and added the new [M2-Total Hours] measure; now we see the same row values but we have a total value this time.
For the new [M2-Total Wages] measure, I used a slightly different technique, seeing as I already have the [M-Total Wages] measure for the individual rows, and I just need a virtual table to calculate the value for the total row. So, for this one, I used the SUMMARIZE method to create a virtual table, and then the ADDCOLUMNS method to add the existing [M-Total Wages] measure. Finally, I used the HASONEVALUE function to check if its an individual row, and if so, just used the existing [M-Total Wages] measure; if it’s not an individual row (i.e., it’s the total row), then I again use the SUMX iterator function to sum over my virtual table.
M2-Total Wages =
// construct virtual table to mimic the physical table
VAR _vTable = ADDCOLUMNS(
    SUMMARIZE( 'Time',
        'Time'[Time ID], Dates[Date], 'Time'[Timesheet ID], Employees[Employee], 'Time'[Hours], Employees[Hourly Wage] ),
        "@TotalWages", [M-Total Wages]
    )
// if single row, return existing measure; it total row, sum virtual table
VAR _Result = IF(
    HASONEVALUE( 'Time'[Time ID] ), [M-Total Wages],
    SUMX( _vTable, [@TotalWages] )
)

RETURN
_Result
And you can see that when I add this new measure to my second measure table, the totals display, and now, when I make a simple bar chart of total wages by department, the chart shows correctly.
Discussion on the benefits and limitations of Measures vs. Calculated Columns
So, to summarize what I found:
Measures:
Pros:
- Best practice
- Measures are NOT calculated when the data model is refreshed, but rather only when actually used in a visual
Cons:
- May require extra DAX code working on a virtual table representation of the visual to properly calculate totals
Calculated Columns:
Pros:
- Easier to learn, and is a familiar starting place for those coming from Excel
Cons:
- Each CC is physically created in the data model and increases the size of the data model and decreases the performance of the report.
For me, I prefer measures and tend to use calculated columns only when I can’t do something easily in measures; measures are my first try for everything (although I do have an exception to this personal rule, and you may have seen it in some of my Enterprise DNA challenge submissions, where I use a calculated column to create a small number of categories when there are many individual dimension values).
eDNA POTW 3 - Timesheets and Wages - DAX - January 2021 - GP Solution - Working Copy.pbix (683.7 KB)


