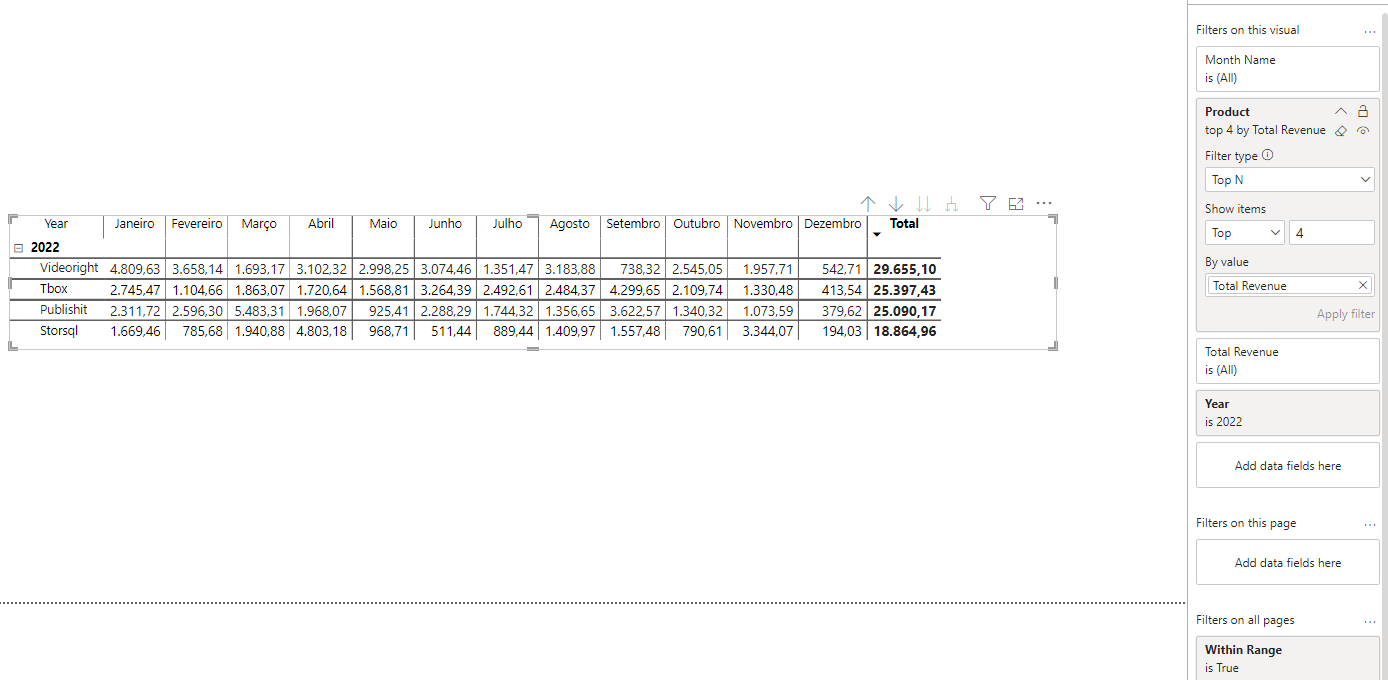
Well I am struggling trying to understand how the filter pane works because I see different results if I filter by year or not and I don’t understand why.
I have this matrix with Year and Product as rows and Month by Column. I just want the top4 products but the result differ if I filter also by year in the filter pane or not as you can see in the following images.
Anybody could bring some light into this?
Thank you
The first image has no year filter activated
well for the year 2021, only last row changes, however for the 4th image, last 2 rows change.
well at top level it appears to work fine, but to investigate thereason why the numbers are changing we really need to investigate what is happening in your data model and your tables.
Please share a working PBIX file so I can investigate and help you better on this.
Filters are filtering your data and base on that you got different results.
Results depends on your dataset.
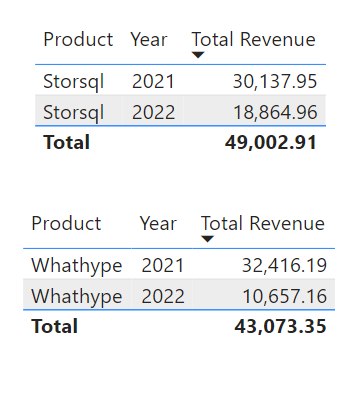
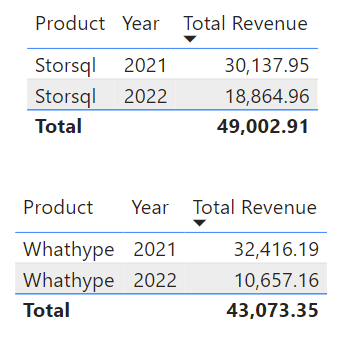
In this that you provide it you have situation that Product Storsql and product Whathype have different distribution over the years
For Storsql Total Revenue in 2021 is smaller then For Whathype in same period (Year = 2021) ( 30,137.95 < 32,416,19).
and for 2022. is opposite (18,864,96 >10,657,16). In total (for both years) Storsql (49,002,91) > Whathype Total revenue(43,073,35)
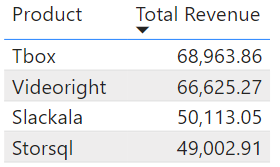
So in first case - when you don’t filtering Year Top4 - On 4.plase is Storsql (has overal total revenue > Whathype ;
49,002,91 > 43,073,35)
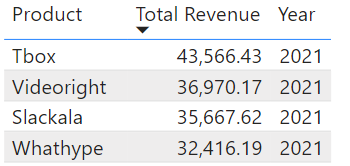
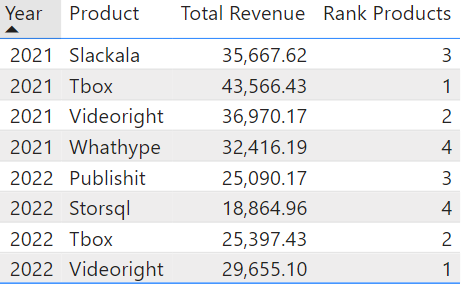
In case - when you filtering Year 2021 Top4 - on 4. place is Whathype (has 2021 Total Revenue > Storsql product (32,416,19 > 30,137.95)
In case - when you filtering Year 2022 Top 4 - on 4. place is Storsql (has 2022 Total Revenue > Whathype product (18,864,96 >10,657,16)
Top 4 places depends if you have All Years, Year = 2021 or Year = 2022
and then fullfill Total sales based on that
(that’s why if you filter just 2021 you got different Top 4 list then for All Years even if you break your visual by year → Calculate Top 4 of overall and then it split values by the years)