Hi Community
I am looking for quite a bit if help using the time/date calculations. I am on a very steep learning curve when it comes to creating dashboards.
I am looking to create a report that basically looks at the sales & budget for last week, last month and year to date.
On the attached spreadsheet/data, there is an example of the finished result i want to try and learn to achieve.
EDNA Data.xlsx (27.3 KB)
EDNA-PBI012 - Weekly Update Dashboard.pbix (325.5 KB)
Any help would be appreciated…
Kind Regards
Darren
Hi @DarrenMoat1 ,
Thank you for reaching out to the community.
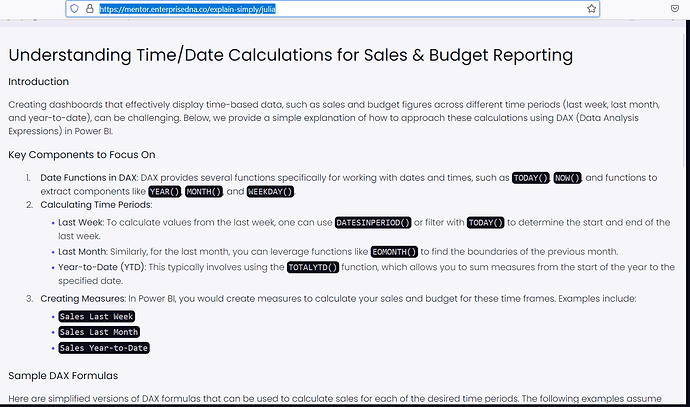
While we wait for other members to share their insights, I’ve taken the liberty of using “Simply Julia,” one of the tools available within Data Mentor (you can explore it here: https://mentor.enterprisedna.co/explain-simply/julia). It generated the following results:.
Feel free to checkout more of our Data Mentor features as you work on your report. These tools are designed to help with tasks like the one you’re working on, and they might accelerate your learning curve.
Cheers,
Enterprise DNA Support Team
Thank you Support Team, I have started following the Dax courses which is greatly helping me to understand how this feature works, slowing creating the measures that help with the report output.
Any pointers from the community forum would be greatly appreciated.
Kind Regards
Darren
