Hi there,
I am trying to show the predicted value of upcoming months based on the average of last 5 values. The regulatory year starts in April and Finishes in March.
The way I am calculating forecast value is the sum of the total value of months of current regulatory years and the last 5-year average value of remaining months.
For clarification, it would be like as follow
The predicted value of upcoming months = total value of current regulatory year + last 5 years average value of remaining months of the regulatory year.
For example, In April current regulatory year starts, so the predicted value of remaining months = actual value of April + last 5 years average value of remaining months (i.e. May to March).
I also don’t want to show the predicted value of months that are gone. For example, I don’t want to show the predicted value of April as it is gone.
To represent the above concept, I wrote the following measure:
Forecast Value =
Var _CYMonth = MONTH(TODAY())
Var _RYMonth = if(_CYMonth > 3 && _CYMonth <= 12, _CYMonth - 3,_CYMonth + 9)
Var sum_last_months = CALCULATE([Normalized Value],FILTER(‘Date’,‘Date’[Date]<=EOMONTH(EOMONTH(TODAY(),0),-1)&&‘Date’[Date] >= [Current_RY_Yr_Strt]))
Var average_remain_month_value = CALCULATE([Average Normalized Value -5y],FILTER(ALLSELECTED(‘Date’),MAX(‘Date’[RY Month Number])>=_RYMonth&&AND(‘Date’[RY Month Number]<=MAX(‘Date’[RY Month Number]),‘Date’[RY Month Number]>=_RYMonth)))
Var total_estimate = average_remain_month_value + sum_last_months
Return
IF(not(ISBLANK(MAX(‘Date’[RY Month Number]))) && MAX(‘Date’[RY Month Number])>=_RYMonth,total_estimate,BLANK())
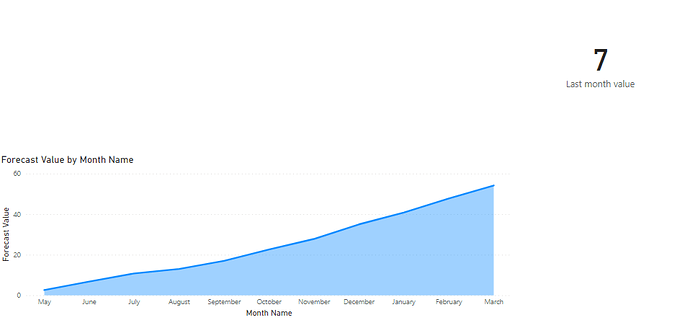
When I tried to plot the above measure in the line chart, it does not add the value of last month of current year value as shown in the following picture:
The value of the last month of the current month is 7. So the predicted value of May should be 7 + 2.68 (based on last 5 year).
However, in figure it only shows 2.68 not 7+2.68.
Could anyone guide me where I am making the mistake? Sample file here

