I have a data set that has 5000 rows and 50 columns. Power BI seems to be managing this okay except the Power Query Summary Statistics seem to be giving the wrong calculations. In general, what are some of the possible reasons for this? I won’t be able to provide the actual data set.
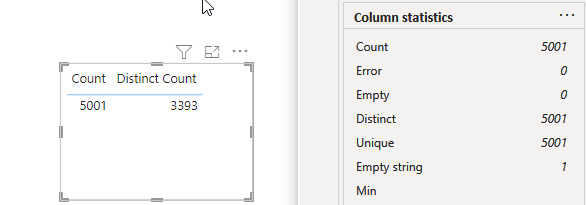
In the attached screenshot, you can see correct distinct count vs Power Query’s column profile summary statistics.
Are you importing an excel file? Maybe you have a row that is empty. Check your last row in your data there might be a string (empty null) in that row. I have seen that sometime a row is added to your data.
I decided to perform a case transformation on this column and I see that when the case for each row is lower/upper, then the distinct count changes. The reporting side of Power BI is not case sensitive whereas Power Query is. Any ideas on which way to go with this?
Hi @powerbideveloper
Yes, distinct count will change as it’s not the same as soon as you transform lower/upper case letters.
Maybe go back to the source of the data and have it fixed there instead of doing it power query.
Maybe review some of Mellisa videos on the learning portal to see if she has something there. Mellissa has some great videos on power query and m.
I would go back to the source and have what you need fixed within the system. Once and done within the system. You won’t have to tie up sources going through power query and fix there.