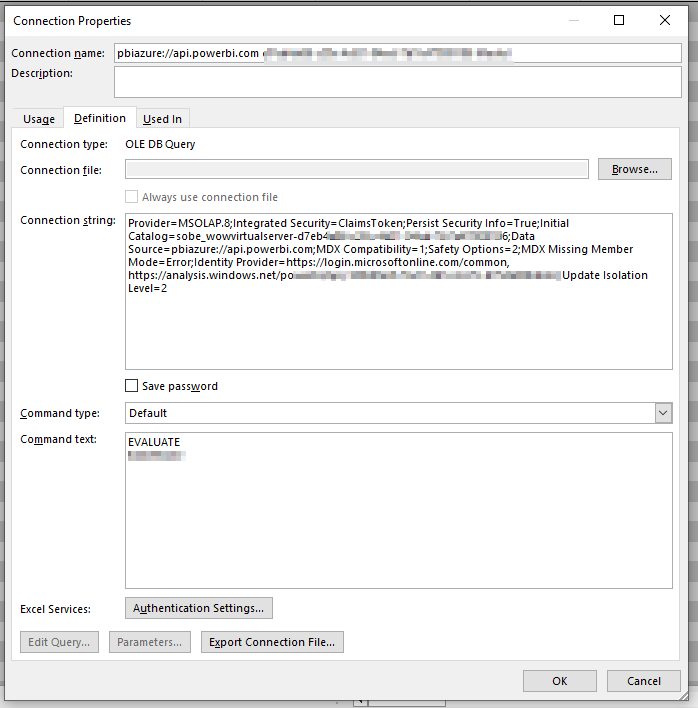
I know this OP has been around a while, recently I have been looking for solutions to get the data to excel and AI has suggested the following. I even had another small table to contain parameters for the query that Power Query would absorb within the one query and place into the Dax. Also once in PQ transformations are again available in the quick example below I’ve renamed the headers. I’m currently on a search for more info on this for other ideas, but struggling to find. I’m now trawling these forums.
let
Dax =
"EVALUATE
VAR EndDate = EOMONTH(TODAY(), 0)
RETURN
SUMMARIZECOLUMNS(
// grouping keys
Plant[Plant],
MaterialMaster[Material],
MaterialMaster[Material Description],
// filters
FILTER(ALL('Dates'),
    'Dates'[Date] >= EDATE(EndDate, -24) &&
    'Dates'[Date] <= EndDate
),
TREATAS({""AU""}, Plant[Plant]),

// measures
""Total Qty"", [Total Qty]
)
ORDER BY MaterialMaster[Material]
",
Source = AnalysisServices.Database(
“powerbi://api.powerbi.com/v1.0/myorg/Your Workspace”,
“Your Dataset”,
[Query = Dax, Implementation = “2.0”]
),
// tidy column names for Excel
Renamed = Table.RenameColumns(Source, {
{“Plant[Plant]”, “Plant”},
{“MaterialMaster[Material]”, “Material”},
{“MaterialMaster[Material Description]”, “Description”},
{“Total Qty”, “Total Qty”}
}, MissingField.Ignore)
in
Renamed
