Category.xlsx (13.0 KB)
Report.xlsx (13.6 KB)
Sample.pbix (186.6 KB)
Hi Experts,
We are using Power Bi - RS Version (Reporting Server) that does not allow many to many relationship.
I have attached the sample data set along with PBIX file for the result which i want.
Background:
We have three separate class Rooms as:
- Standard
- Executive
- VIP
Everyday the rooms are checked by senior trainers and give their ratings from 1-3 (Where 1 is lowest and 3 is highest). My boss want me to prepare a 3 page report for each class room room separately.
The report which we get is shared in excel file and that contain audit ratings of each room in separate sheet. the Attributes have 1 main category and sub category than the attributes which is stored separately for each class room in category file. it does contain duplicates and same is highlighted in excel file.
Note: This is sample data and actual attributes for each class consist of 250 attributes that needs to be checked.
I have following Issues:
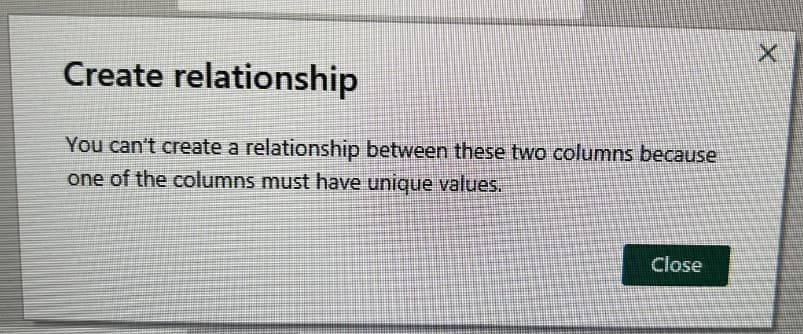
In the Power Bi RS version i am unable to make many to many relationship as it gives below error.
I cannot remove the duplicates from the Category file since the sub category is different.
Check sub category - Washroom(Building) & Washroom(class).
Expected Result:
I want to have a 3 page report for each class room separately, where i will give filter based on each class room type and Main Category. How can i effectively design the model to achieve the expected result.
Note: in the attached sample PBIX file, i am able to built the relationship of many to many since i am using desktop version here. In the office i cannot do because i have Power Bi - RS version.
Appreciate your help and guidance.
Although PowerBI Reporting Server has a limitation on supporting many-to-many relationships in its design, it presents an excellent chance to explore different model design options that can help you move towards a Star Schema compared to the current state. By doing so, you can improve your data model, enhance report designs, and support KPIs. Once a clear set of requirements has been established, you will find a great deal of supporting information on Data Modeling in EnterpriseDNA beyond the Forum.
.
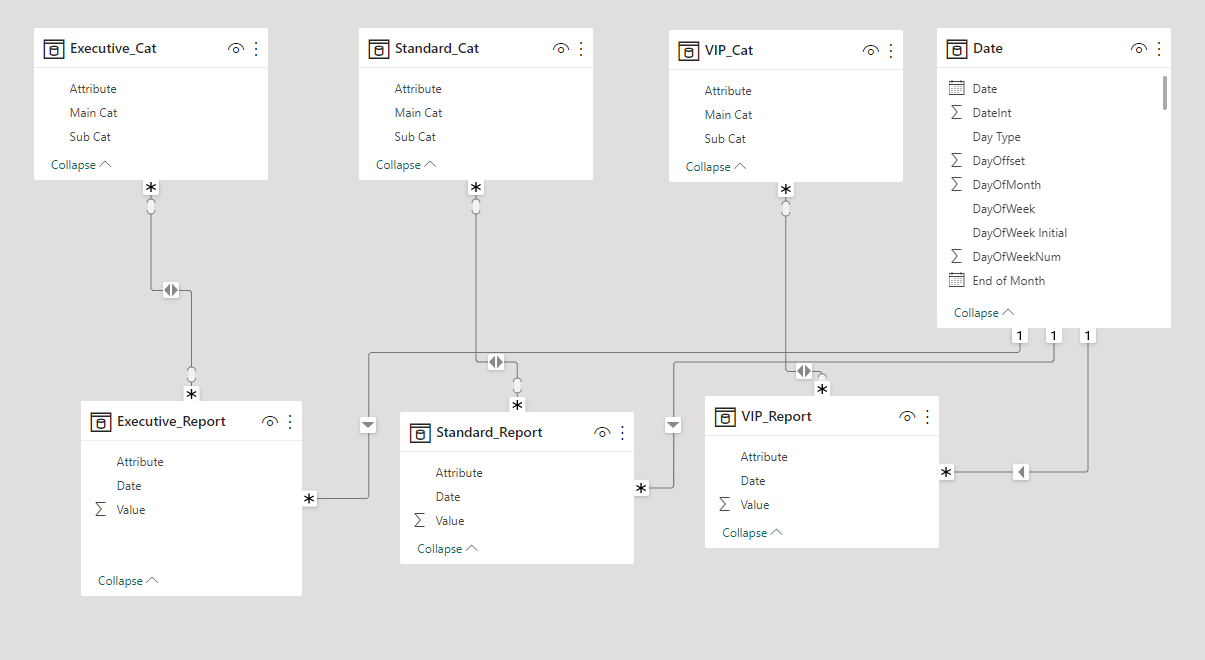
Image of your current Model View
.
Option: Update current model design with the addition of Bridge Tables
Previously, to solve the issue of many-to-many relationships, a commonly used method involved adding Bridge Tables to the model. While this approach may still be the simplest solution, it’s worth taking a closer look at the tables and relationships within the Power BI Desktop file to find alternative solutions. More information is contained in the Resources Section of this reply.
.
The following article discusses how to model survey-style data using a relatively simple approach. This method did not have Power BI Reporting Services in mind; however, the designs would apply.
.
Resources Section
• Microsoft Learn: Relate many-to-many dimensions
• Microsoft Learn: Factless fact tables (bridging table)
• Server Interactive Blog: How to Join Many to Many with a Bridge Table in Power BI
• SQL Server Builds Blog: Power BI Report Server Versions Change Log
–
 If this post helps, then please consider Accepting it as the Solution to help the other members find it more quickly.
 Did it contribute positively towards finding the final Solution? Please give it a like.
Dear @ystroman
Thank you for your detailed answer.
I am truly thrilled how you have explained and provided additional resources for me get more understanding.
Thanks alot for your time to write to me and provide your guidance and help.
Hi @EnanBahadur, you are welcome, and I wish you the best of luck and smooth sailing in overcoming the issues presenting in summarizing the results of the HSE Surveys.
1 Like