Hi All,
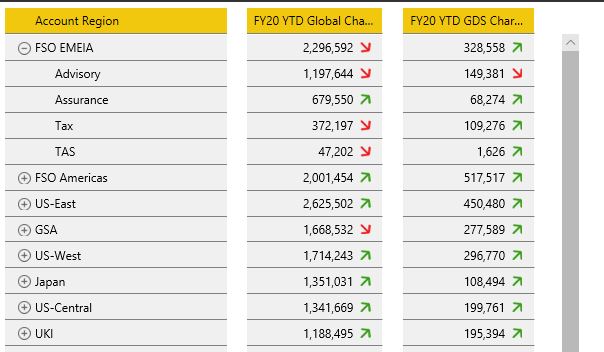
I have attached a screenshot of power bi report table from internet. This is a metrix table with +/- enabled. But not sure how do i make the columns looks like in attached screenshot. Any suggestion will be highly appreciated.
Thanks in advance.
Hi @nbaraili
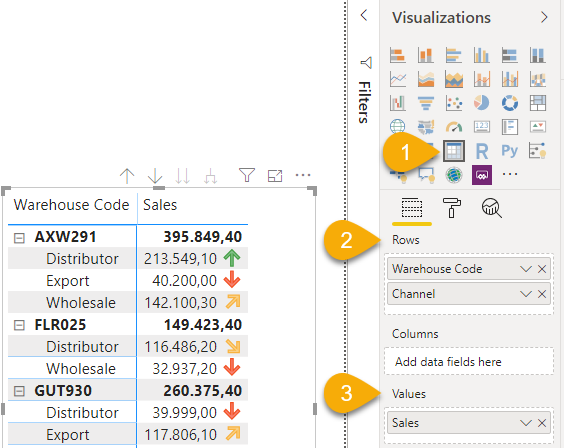
To get levels in your matrix visual, all you need to do is just add another category to the Rows section.
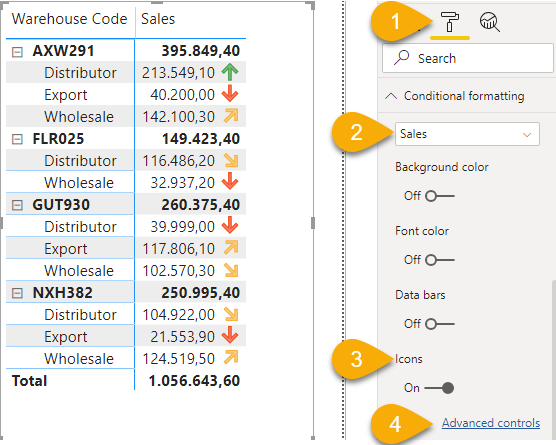
For icons use the conditional formatting option for any given Measure in the Values section.
If this answers your question please don’t forget to mark this post as solved - thank you. Happy Holidays!
matrix visual w levels & icons.pbix (47.7 KB)
Thank you very much Melissa.