Thank your EntrepriseDNA for organizing these challenges. Not only they are useful for learning, testing new things and building our own portofolio, but it gives also the possibility to be inspired by fellow EDNA members, and progress at a much faster pace.
The difficulty of this challenge, in my opinion, was delivering an important number of analysis without losing the focus and interest of the end user.
We had to decide how to present the data to the end user in a way that is simple and comprehensive.
Here are the different steps I took in order to build this report:
Understand the Data & the business needs
I think that taking the time to understand the data is a very important step when building a report. I looked at the data, read the comments and answers of the other members, read the site recommended by @BrianJ that provided a short description of every field in the dataset.
I also looked at the JIRA system we have in the company I am working at.
I even had a discussion with some collegues who are working with the tool (I did my investigations to understand what are the main KPIs, what they struggle with, ask questions concerning the rules, etc).
I searched online for sites/apps/ dashboards in excel or other tools to see what kind of information is generally presented when you create ticketing dashboard.
Every time I found something interesting, I take notes on a piece of paper.
(Even though I consider myself quite digital, I like writing down ideas and drow prototypes on paper).
So, after this investigation phase, I understood the JIRA fields, I knew how they are managed inside my company, I had some ideas of what could be interesting to build.
From the dataset perspective I knew I had to solve the child/parent hierarchy , I noted down the problems concerning Status, Priority, Timings, and the data quality.
**Selection Phase
I started to create a page for every single requested analysis in order to make sure that I will not lose focus on what is requested. I created a lot of tables. I always create tables before creating visuals, as it permits to check the numbers. After creating all these tables, I wrote one sentence on each page. What is the main message, idea, the most interesting finding I discovered.
At the end, I resumed all the ideas and all the tables to just a few clear, interesting findings needed to develop my report.
**Data modelling
- Remove unnecessary columns:
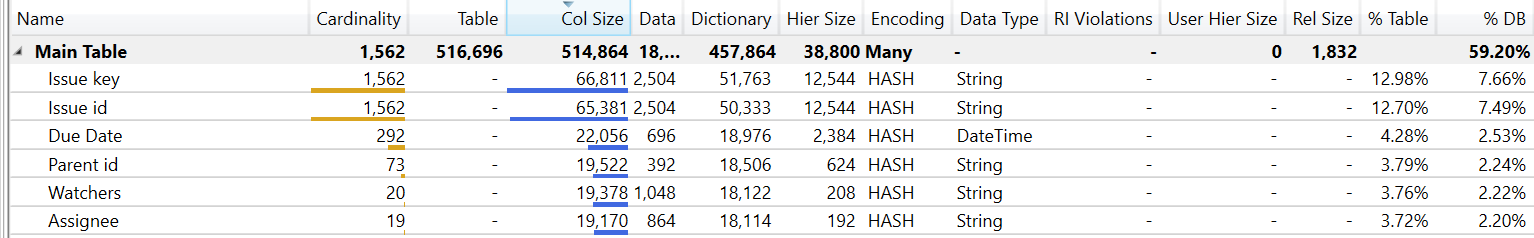
I was intrigued by the the field “Issue key”. Do I really need it? It takes place, it has only
unique string values. I used DAX studio from the External Tools to have a look.
I told myself that I will start by removing it and come back later if I really need it
I also remove the column Project type as it brings no added value
- I created a column New Status that will be used with a dimension table.
if [#"Duration Expected (Days)"] <> null and [#"Duration Expected (Days)"] < 0   then "Incorrect Due Date"
//else if [#"Duration (Days)"] <> null and [#"Duration (Days)"] < 0   then "Incorrect Due Date"
else if [Assignee] = "" and [Status] = "Closed" then "Canceled"
else if [Assignee] = "" and [Status] = "Pending" then "Unassigned"
else if [Assignee] = "" and [Status] = "Resolved" then "Canceled"
else if [Assignee] = "" and [Status] = "Done" then "Canceled"
else if [Assignee] = "" and [Status] = "Open" then "Unassigned"
else if [Resolved] = null and [Due Date] = null then "Incomplete Unassigned"
else if  [Resolved] <> null and [Due Date] = null then "Incomplete Resolved"
else if  [Resolved] = null and [Status] = "Done" then "In Progress"
else if  [Resolved] = null and [Status] = "Closed" then "In Progress"
else if  [Resolved] <> null and [Status] = "In Progress" then "Resolved"
else if  [Resolved] <> null and [Status] = "Pending" then "Resolved"
else [Status]
-
I added a Date Table using Melissa M code and marked it as Date Table
-
I added a Periods Table because I thought it will work well for this kind of report and also because I never used it. In order to understand how to build it, I read
Dynamic Date Range Slicer- Query M post written by @JarrettM: Dynamic Date Range Slicer- Query M
and read the write up and looked closer at the report created by @Greg in the previous challenges. -
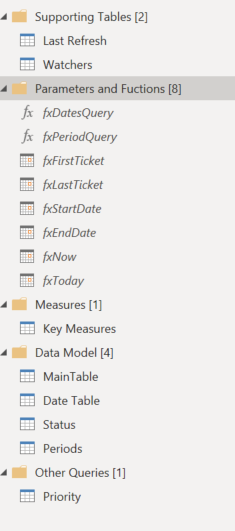
I created a Key Measure Table
-
I created 2 dimension tables: Status and Priority. For priority I added an Index because I new I wanted to sort the values in the following order: Low / Medium / High
-
I created a Watchers table where I pivot the data to have the list of watchers per issue ID. In the end I did not use it in my report.
-
I checked all the data types and the names to be as clear as possible
-
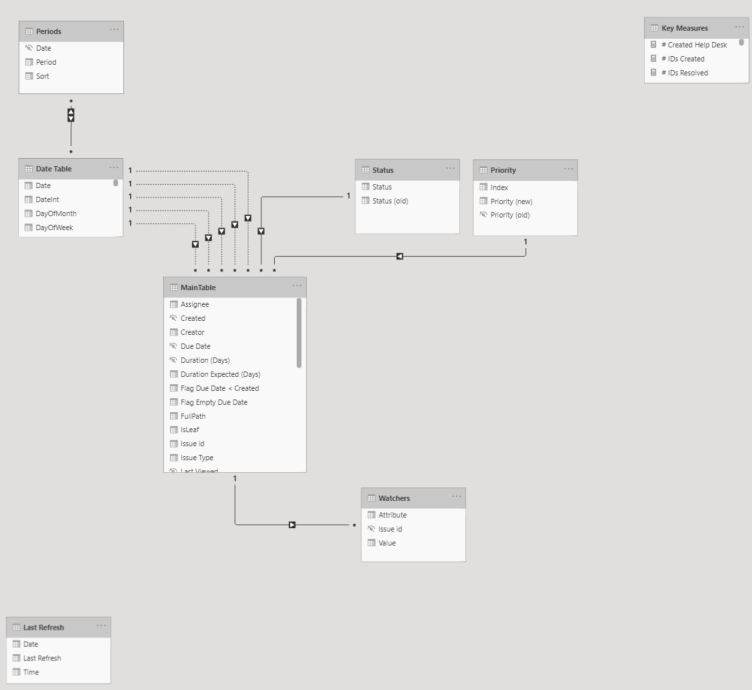
I grouped my tables into folders as best practice to keep the model clean and clear
-
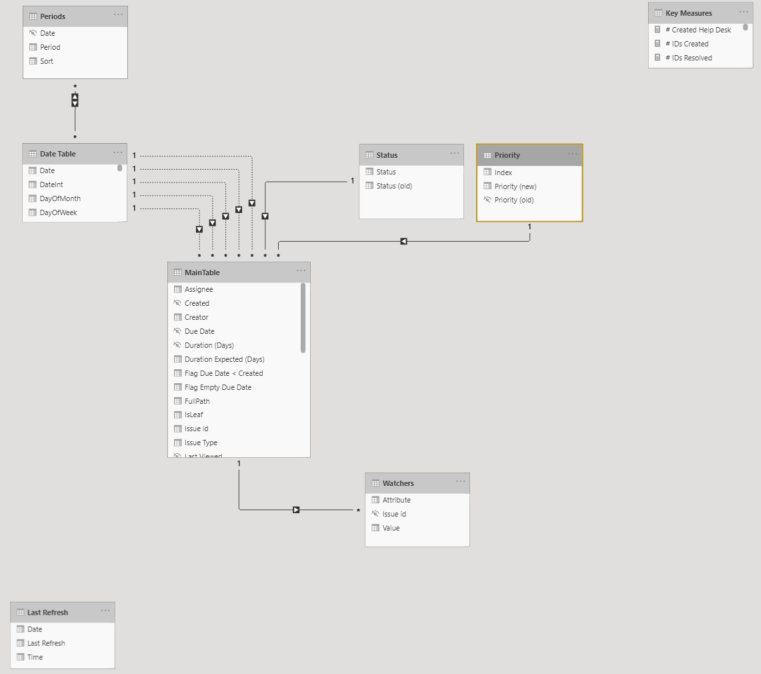
I organized the tables using Sam waterfall method which I find very useful to understand fast the logic of the model (I forgot Watchers table below the fact table, it should be positioned at the same level as Priority and Status)
**Navigation, Background and Visuals
At this point I have a clear picture of all the analysis and findings I want to create. I started with the child/parent topic.
I created new columns:
FullPath =
PATH('MainTable'[Issue id],'MainTable'[Parent id])

NodeDepth =
PATHLENGTH( 'MainTable'[FullPath] )

IsLeaf =
VAR
    CurrentPersonKey = 'MainTable'[Issue id]
RETURN
CALCULATE (
    COUNTROWS ( 'MainTable' ),
    ALL ('MainTable'),
    'MainTable'[Parent id] = CurrentPersonKey
) = 0

Level1 =
LOOKUPVALUE(
    'MainTable'[Issue Type],
    'MainTable'[Issue id], PATHITEM ( 'MainTable'[FullPath], 1, INTEGER )
)

Level2 =
IF (
    PATHLENGTH ('MainTable'[FullPath] ) >= 2,
    LOOKUPVALUE (
        'MainTable'[Issue Type],
        'MainTable'[Issue id], PATHITEM ( 'MainTable'[FullPath], 2, INTEGER )
    ),
    'MainTable'[Level1]
)
and a new Measure:
PC Amount =
IF (
    MAX ('MainTable'[NodeDepth]) < [BrowseDepth],
    BLANK (),
    [Created IDs])
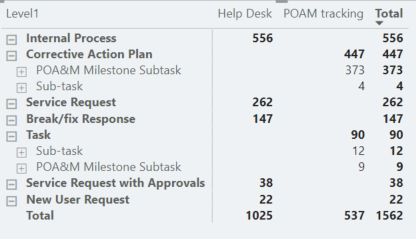
I created a hierarchy with Level 1 & Level 2 and put all the data inside a matrix
I then thought about colours and design. For colours I used https://themes.powerbi.tips/ to create my theme. I hesitated between a dark background and a white background report. I usually go for dark background, but this time the white force pushed me to use more classical colours.
I then opened power point and started thinking about the design.
I usually use Power Point to create a background of all static images, shapes, etc in order to reduce the number of elements inside a Power Bi page, and therefore gain in terms of performance. Also, In Power Point you can get quite creative and spice your report.
For the navigation part, I was inspired by this report and thought I can do something similar
https://www.doh.wa.gov/Emergencies/COVID19/DataDashboard
For the periods, I used a dynamic menu because the period filter did not fit well visually inside my report. I wanted to make the pages as simple as possible so that all the focus of the end user to be on the data.
It was a bit of struggle to create all the navigation fly out but at the end I was satisfied by the result.
Based on the decisions I made concerning the navigation and the background images, I thought that one page will suffice. It is more difficult to create a report with multiple analysis inside one page only, but it is also very good practice as you need to work with bookmarks and also be very organized with the visual elements (name/order/groups)
**** User Journey and data vizualisation**
In order to build the user journey I made multiple tests and tested several ideas.
The strategy was to start only with the most general information, the big picture, and with the use of interactions give progressively more and more data to the end user by anticipating the first possible questions.
For example, when the user will connect to the report, he/she will see
-
The fact that there is a navigation menu with buttons that show a certain path to take: First the Overview, second timings and last data quality &
the blue ribbon with the 2 main projects in our Jira: Help Desk and POAM.
For the circles I used a dark blue colour in contrast with the light blue background to create a pre attentive signal. I am sure the eyes of the user will stop for couple of seconds. I want them to stop at that precise place not for visual design, but to send some key findings: There are two projects, one that has 1025 tickets created on close to daily basis, and another, smaller, 537 tickets, where the issues are consolidated and launched at once. -
Then the end user will see a big BAN (big angry number ) ==> 512 unresolved tickets for all dates. This sets up the tone of the report and naturally the user will ask questions.
Why? When? Where? -
They will then see “Assinee with most unresolved tickets” and at the end they will see the charts in the lower part of the page.
I will stop just for a second on the graph below because I discovered this method quite recently, despite the fact it is very easy to set up.
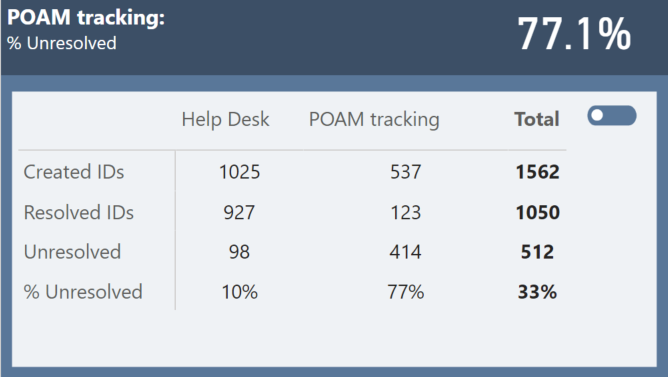
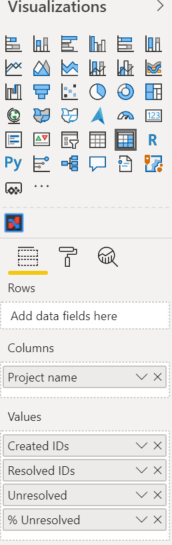
The graph below is actually a matrix where the column names are show on rows.
In order to set this up you just need to go to Values and switch on “Show on rows”
This small trick can help you improve quite alot the performance of your report especially when you have a lot of visualisations in one page (cards)
Back to the user story.
An user can see very easily the performance on the two projects, the number of unresolved tickets and the dynamic of the projects
Using the two toogles, the end user has the possiblity to build 4 different screens.
He/She can also click on the name of the assignee with the most unresolved tickets.
For example, when you click on the name of Richard Hendricks you find out that he works exclusively on POAM project, that he is assigned to 226 tickets and only solved 3.
Then, by switching the toogles you can find out that basically all the tickets concern corrective action plan for POAM. One last toogle switched and you find out that the problem of the unresolved tickets is not new. From the beginning of the year those tickets assigned to him are unresolved. So the end user now knows that those tickets are not only unresolved, but they are also quite old now.
Next question: What priority status have the tickets for POAM?
==> Timings
This page is more dense, and develops an analysis for all timings. Here I introduce the problems of data quality : 92.4% of Due Dates are missing for project Help Desk,
A low priority ticket has an average expected duration (based on due date) of 5 days, whereas a high priority ticket has an average of 47 days. There are problems not only with the Due Dates missing but also with the Due Dates that are assigned
In the page we also find out that most of the tickets are medium priority and 1/3 of the high priority tickets are unresolved ( 109/114 high priority tickets for project POAM are unresolved!)
I finish my report with a page that proposes improvements for the current process.
The solutions proposed will solve the most important problems related to the root cause of the data quality in the system and proposes a new way of dispatching tickets in order to avoid bottlenecks.
Test your report and small details
In this last step I check all my bookmars, my visual elements, my filters,
I re arrange the elements in groups, I format my measures and arrange them inside folders. I delete what I did not use.
When I think I am done, I connect to the external tool Tabular Editor
and go to Tools/ Manage BPA Rules
I click add and connect to the Tabular Editor Best Practice rules repository
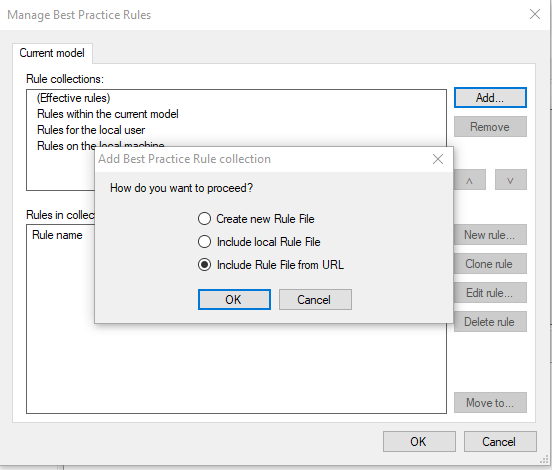
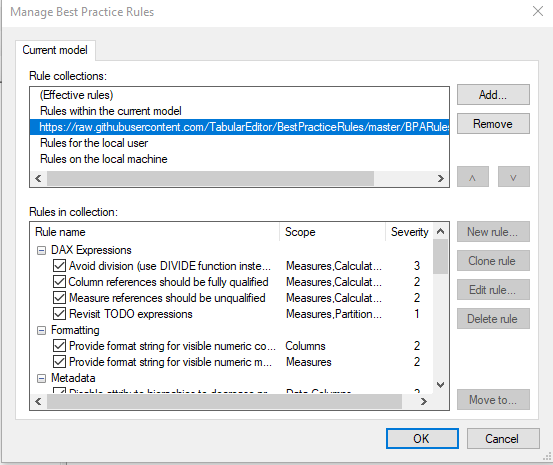
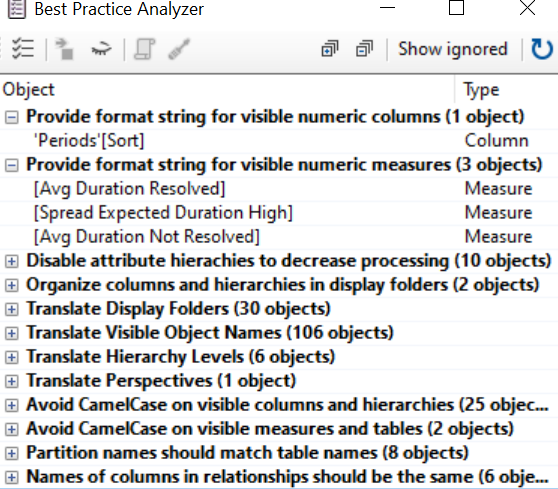
I then go to Best Practice Analyzer, right click on the issues I want to solve, generate script fix, paste it and and apply it if necessary.
Now the report is finished and ready to be sent !
And that’s it! This was the story of my report for Challenge number 8. See you next time!
Best regards,
Alex