Congrats, @MudassirAli your submission was superb
1 Like
Thank you everyone for your support and participation in the 6th Power BI Challenge!
@JarrettM I was trying to open your submission pbix file for Challenge #6, I got an error message that the file is either corrupted or encrypted.any ideas?
Working fine on my end. Make sure you are using the latest version of Power BI. Sometimes if you are using an older version that error will appear.
Thanks
Jarrett
@JarrettM
Thank you for the update, but I’m using the latest power BI desktop version. The issue is only on this particular Pbix file. can you be able to share that in this thread? Thank you @jojo
@jojo,
Where are you trying to download the file? Please post a link to the thread where it is posted. I’ll update the file if I need to, no issues.
Thanks
Jarrett
@JarrettM,
Here is the thread I was trying to download the file from.
Thanks,
Joseph
1 Like
Here is the file. Opened fine for me.
EDNA Insurance Complaints- Jarrett Moore.pbix (3.0 MB)
Thanks
Jarrett
Hi @BrianJ,
I’m working through the solution you submitted here. Could you please share the below file with me?
Benford.xlsx
C:\Users\brjul\Documents\Power BI Coding\Enterprise DNA Files\Data Challenges\Data Challenge 6\Benford.xlsx
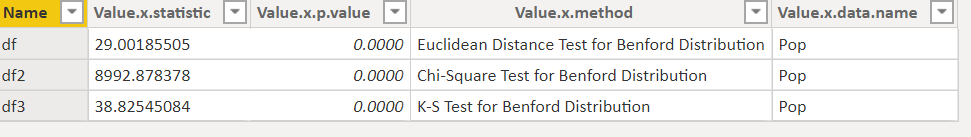
If you’re interested, I recently rewrote the R script for the Benford hypothesis testing on population to work with the data table BenfordPopulation entirely in Power Query – import and convert the CSV file, run the R script for the Benford analyses and output the results of the hypothesis test to that same table in PQ. Here’s the code that goes in the R Script window when you click on Run R Script:

library(readr)
library( BenfordTests )
library( benford.analysis)
Pop <- dataset$population
BenfPop <- benford(Pop, 1, sign="positive")
x <- edist.benftest(Pop, digits = 1, pvalmethod = "simulate", pvalsims = 10000)
df <- data.frame(x$statistic, x$p.value, x$method, x$data.name)
x <- chisq.benftest(Pop, digits = 1, pvalmethod = "simulate", pvalsims = 10000)
df2 <- data.frame(x$statistic, x$p.value, x$method, x$data.name)
x <- ks.benftest(Pop, digits = 1, pvalmethod = "simulate", pvalsims = 10000)
df3 <- data.frame(x$statistic, x$p.value, x$method, x$data.name)
dftemp <- append( df, df2 )
output <- append(dftemp, df3)
- Brian
1 Like
Thanks very much Brian!
I was thinking about R and Python and Power Bi the other day. It was whilst I was posting a question to the powerbi forum asking if there are plans to support the python library, plotly (or plotty as I like to call it).
It occurred to me then that what would take me a few seconds in Minitab to analyse data (explore the boundaries of my data set, possible relationships between variables, its distribution etc etc) would take me hours with power bi / R / python.
Do you ever think that Minitab (or tools like it) are actually more appropriate for (least I say it) as a “data science” tool ? Its just that they aren’t the latest in vogue tool to use?
(sorry I guess this really ought to be a different thread)
I don’t know a thing about Python, so can’t help you there, but I can tell you that you definitely can use Plotly within R within Power BI. As you’ll see from the link below, it ain’t easy but it’s definitely doable if you’re sufficiently motivated:
https://towardsdatascience.com/interactive-power-bi-custom-visuals-with-r-a6a4ac998710
I haven’t used Minitab in literally 30 years, so I can’t speak to the appropriateness of it as a data science tool, but to some extent I think it’s a matter of what you get comfortable with. When you watch someone really fluent in R, they can do all the things you mention in a matter of seconds. I really like Greg Martin’s R videos - if youse watch a couple, you’ll see how effortlessly he breezes through his data analysis.


 and dplyr and ggplot")
I’m actually amazed that tools like Minitab, Stata, SPSS, etc. have continued to maintain even threshold commercial viability when you look at these two numbers:
Combined annual cost per user for R and R Studio: $0 (Minitab: $1,400/user/year)
Available open source, free packages for specialized analyses within R: 21,216 (Minitab: 0)
So, I don’t think it’s a matter of R currently being in vogue. If anything, I think it’s going to become far more firmly entrenched as the data science standard for statistical analysis as more and more colleges and universities adopt it as their primary platform (both because of functionality and cost), and students enter the workplace with that fluency already in hand.
- Brian
1 Like
Hi Brian… you got me! Haha, yes - - the ever true preference for holding onto things you know. I’ve resisted the R bandwagon and its high time I jump on… if only for the cost of it. Thanks for the candid reply ![]()
And how my goodness, you’re completely correct! Power Bi supports plotly for R I didn’t even think of checking for R. Definitely no Plotly for Python though, not yet anyhow.
I found my scatter plot then! I’ll post back on the original thread (and working on it next week).
As always - thank you,
Michelle
1 Like