You’re spot on about the gap between the quality and quantity of M versus DAX resources (at least until we can finally convince @Melissa to write “The Definitive Guide to M”…). in the interim, we have put together the following resource list, which is the best of what we found out there, but encourage everyone to add to this list as you find other good resources:
In addition, you may find this video helpful in terms of M practice strategies and tools:
WOW! I actually went back and compared the two entries side by side since my first impression was that this was a totally different entry. Amazing the difference the color theme change made. Really like the look of the revised version.
Would have to say, not my best work, but after being forced back into lock down in the last couple of days due to COVID in NZ, my creativity juices aren’t as alive at the moment.
I’ve kept it pretty simple this time round, but covered the brief.
It’s amazing how long this took me, when I look back and nothing I’ve done is that difficult. I guess it comes down to how creative you are feeling and if you can get into the ‘analytical zone’.
So impressed by other submissions to the challenge.
I’ll do my best to promote these in coming weeks. Just such good stuff, the whole world needs to see them!
The color theme looks very good and like the revised version. Itching to get started on the challenge but haven’t been able to due to work overload. Will submit my work over the weekend.
Fingers crossed!
I am struggling here with DAX calculations. Started looking into the challenge and I am missing a point which is messing up my calculations. I am trying to calculate the number of appointments missed. First I created a measure as
IF([Days since Last Appt] >[Appt Freq Days],“Missed”,“Not Missed”)
but then unable to count the number of appointments missed as Count function doesn’t work with measures but tables.
I know it’s a simple calculation but I am missing a point here big time.
@sunip Thanks for the reply. What I was missing was virtual tables in my calculation. With virtual tables, I can count or sum easily. Saw @sam.mckay videos on the channel and figured it out and now working on my report.
The challenges are so interesting that it pulls you into making a submission for the challenge. Been quite busy since the last fortnight but managed to create a report (that’s EDNA Power)
Tried to create a simple report
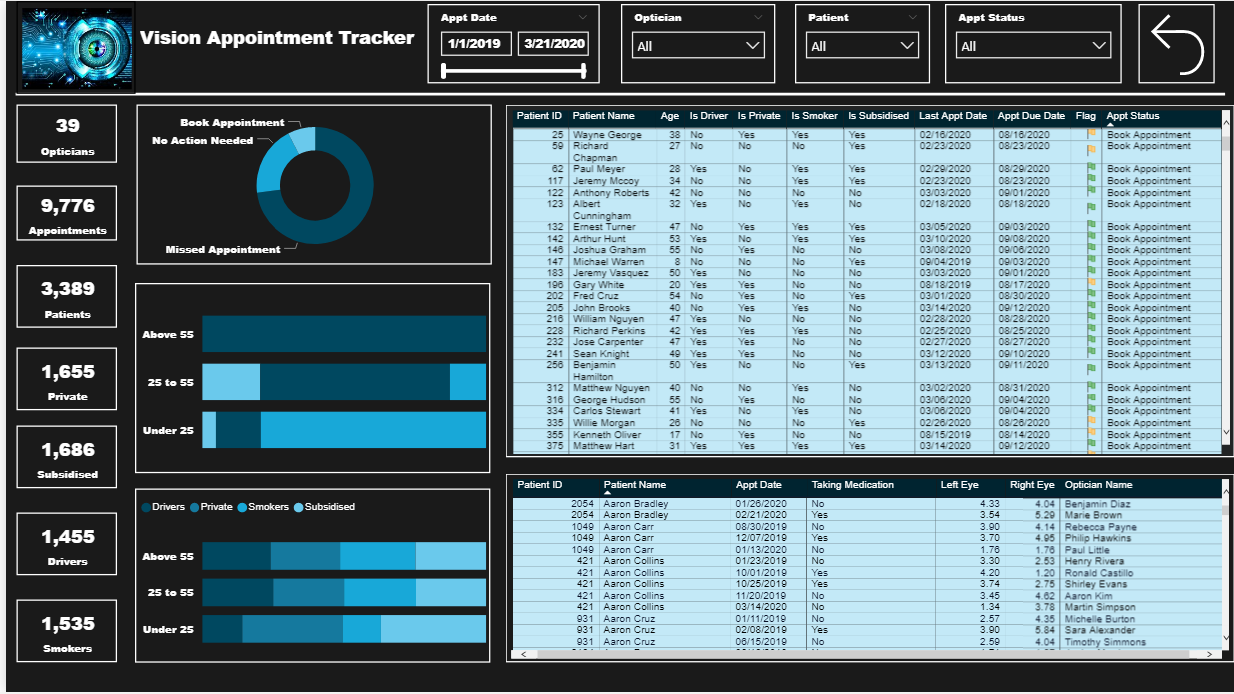
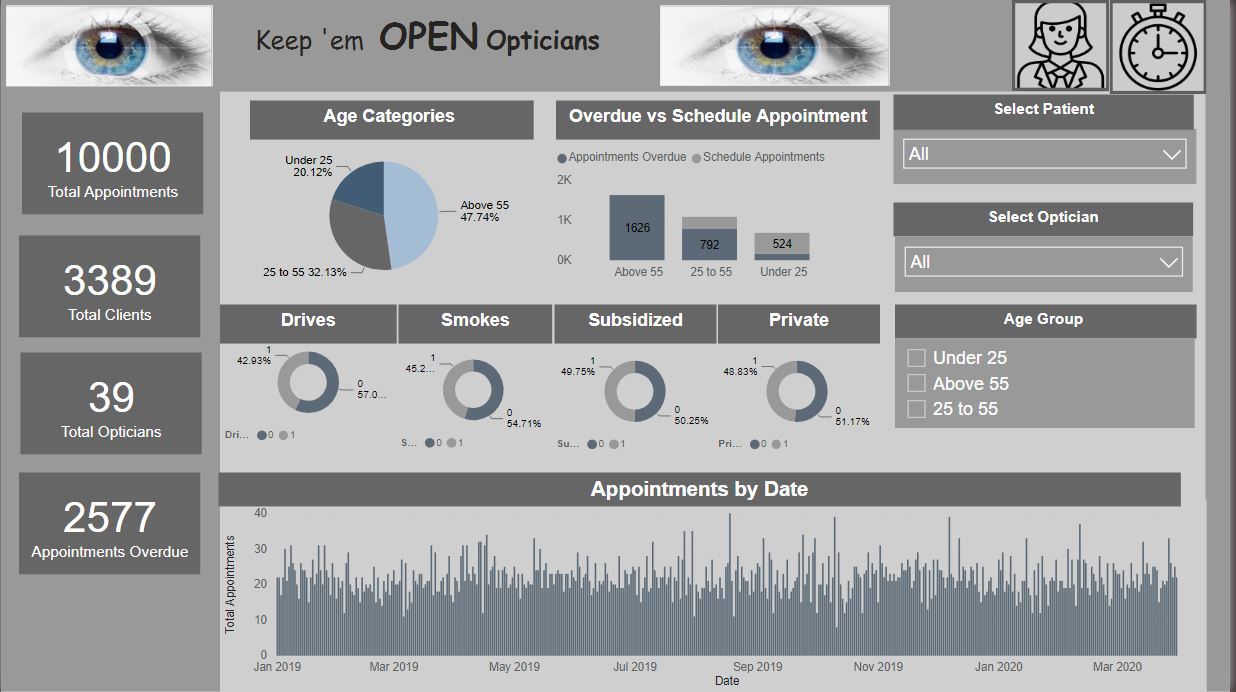
Overview
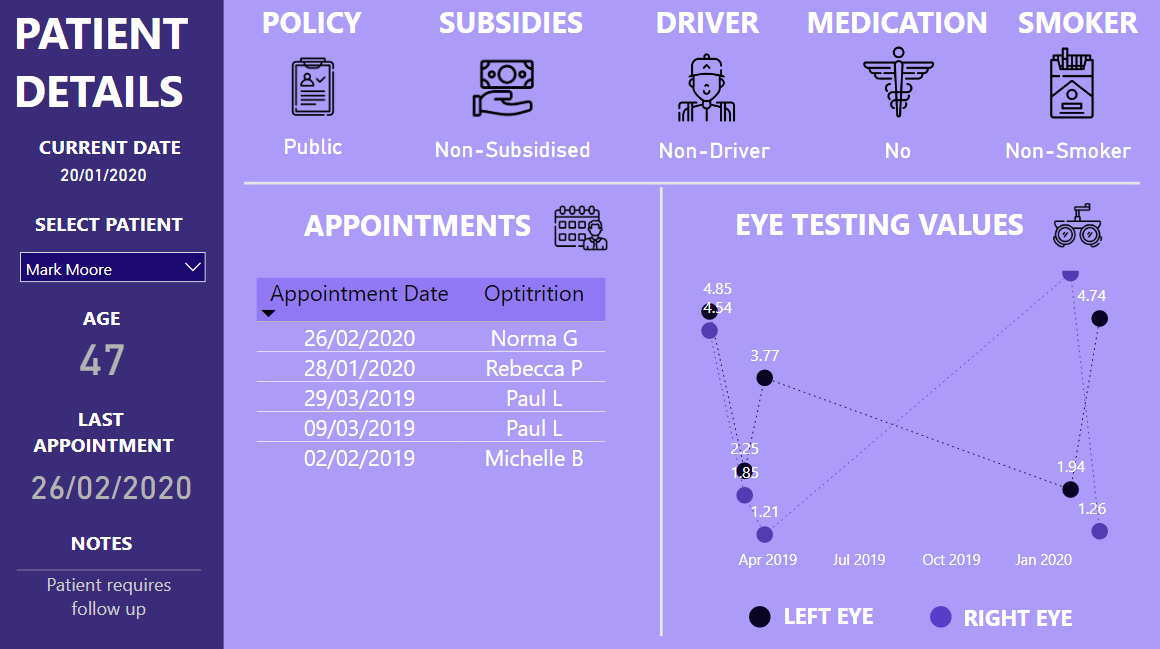
Patient Information
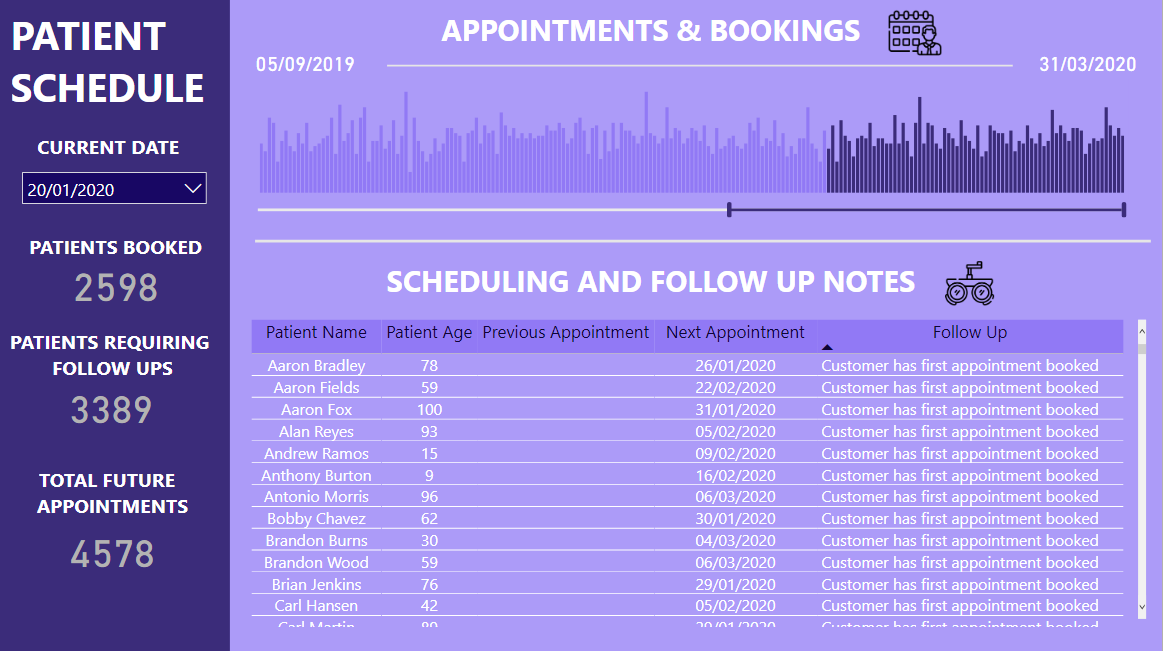
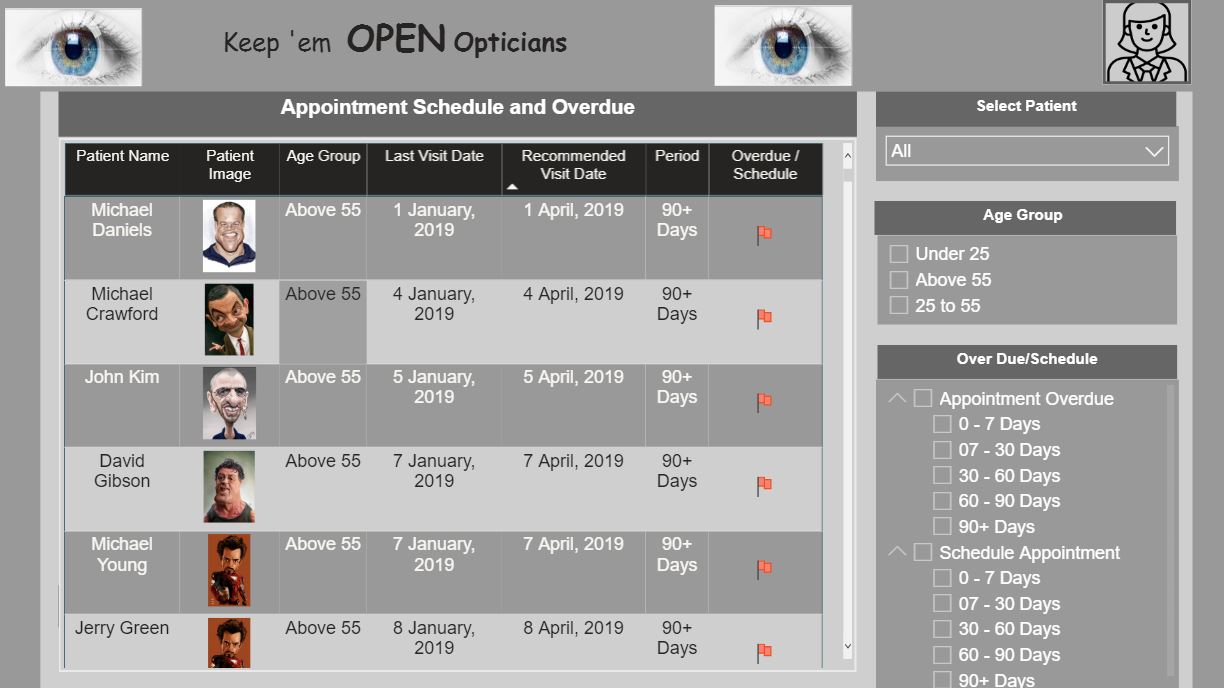
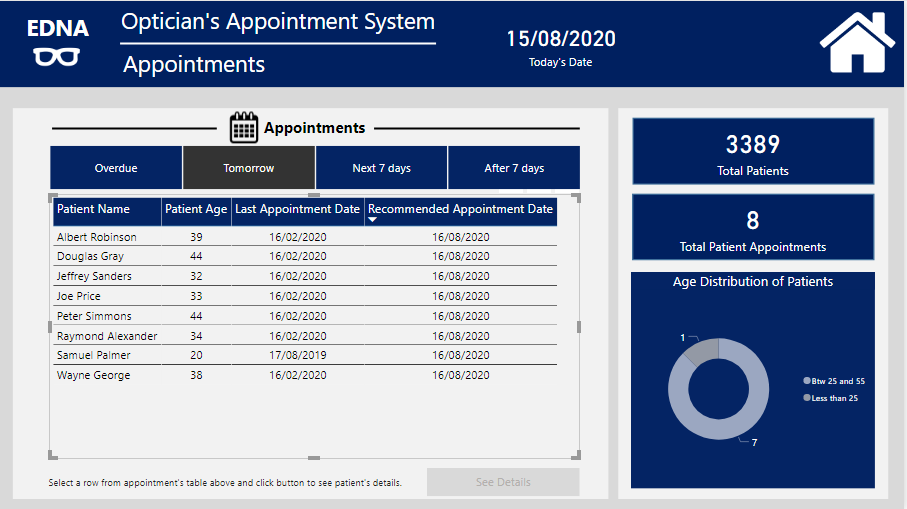
Appointments (To be scheduled and Overdue)
Overview Page
Simple explanation and summary of the data drilled.
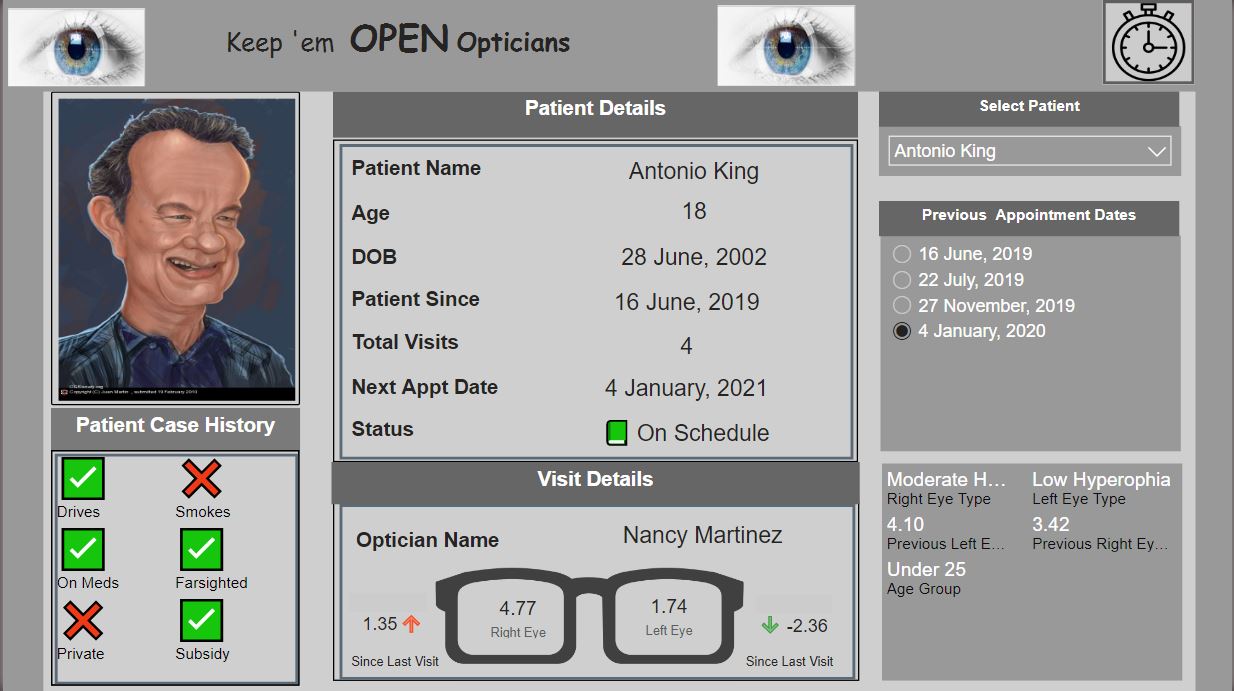
Patients Information
Took some inspiration from @BrianJ submission . I have never worked on Python. Tried to code but was unsuccessful so I extracted the image url’s of some images from Google manually.
Used UNICHAR for the cross and tick mark signs.
Appointments
This was a little tricky and I used Calculated Columns to create the segments. I am still trying to lean M code hence DAX was my savior.
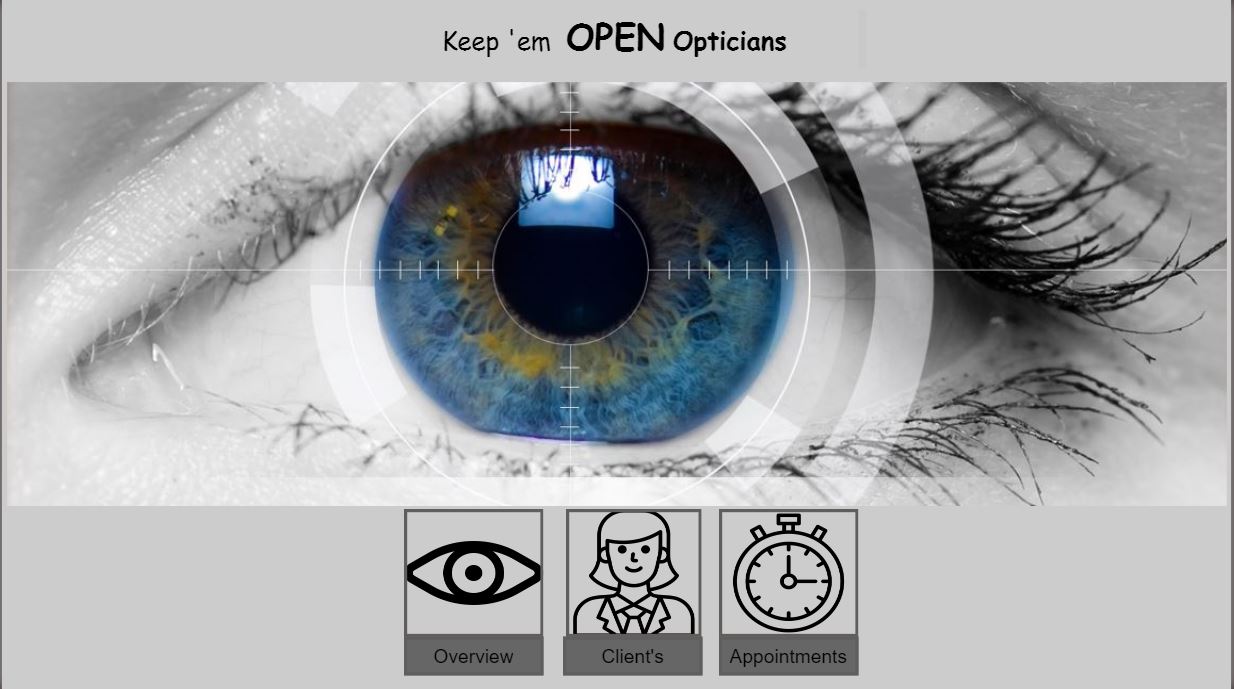
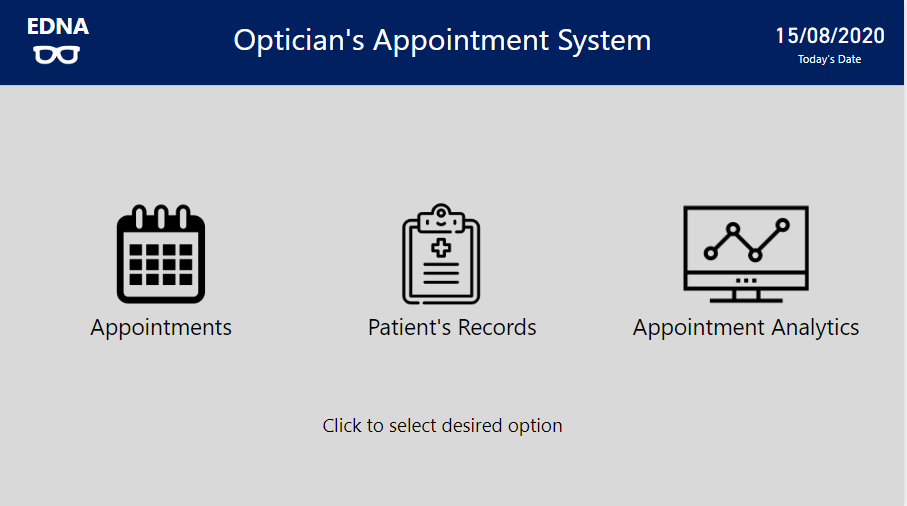
The report has a menu page that can be used to navigate to
Appointments
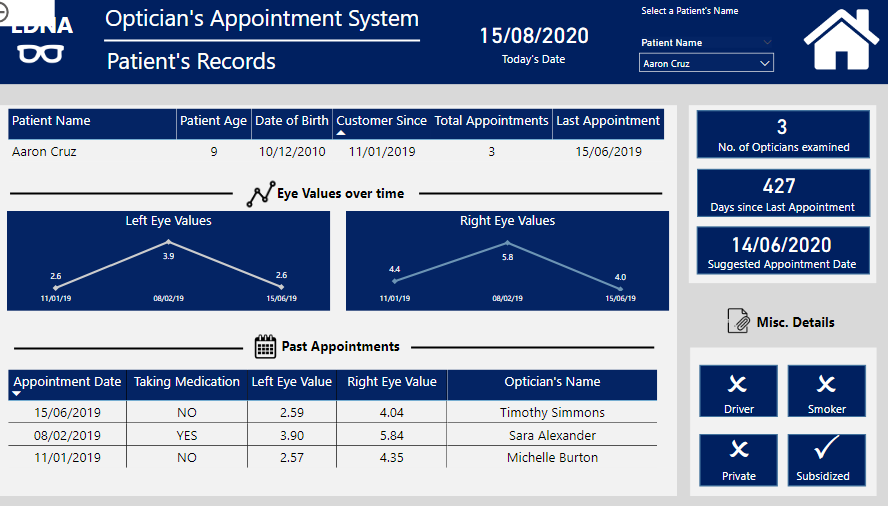
Patient’s Records
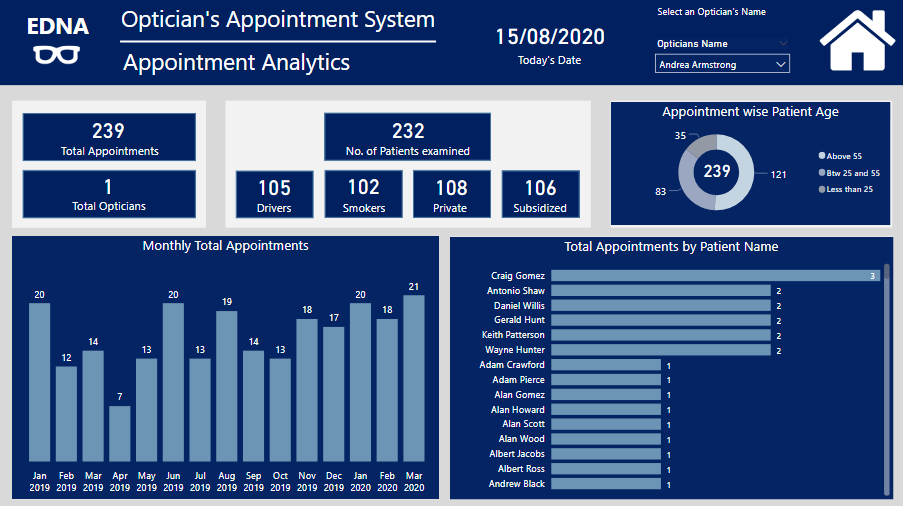
Appointment Analytics
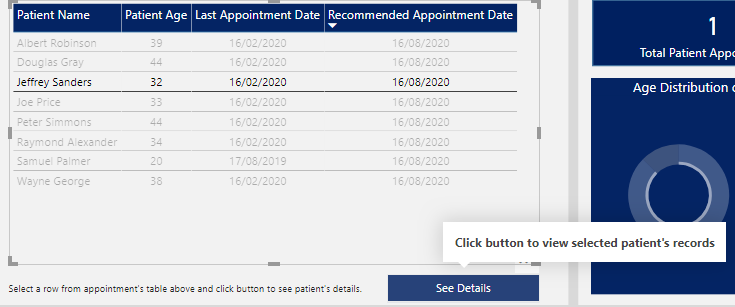
The medical record for the selected patient can also be accessed through the Appointment page by selecting the desired patient and pressing the ‘See details’ button. I have used the drill through feature for this functionality.
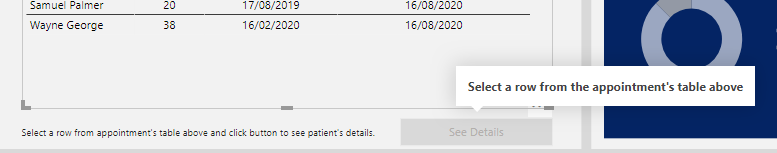
Once the desired row is selected from the table, the ‘See Details’ button gets enabled and the selected patient record can be seen on clicking the button
The appointments can be filtered based on the following options
All overdue
Due tomorrow
Due within next 7 days
Due after 7 days
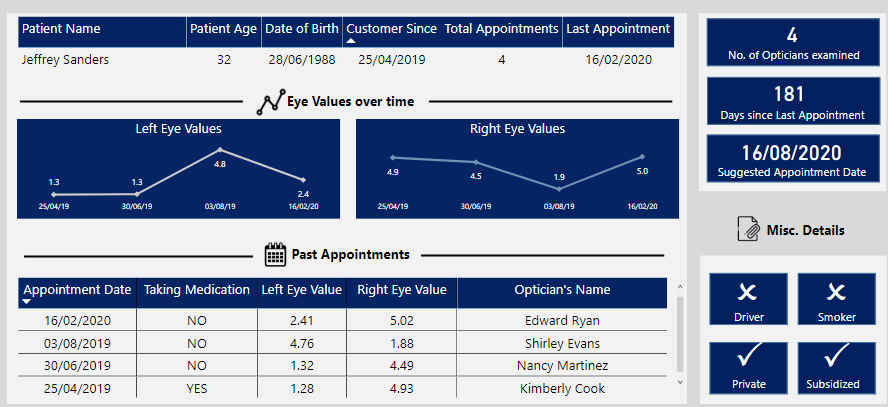
The patient’s record includes the metrics in numeric form and the trends over time for the eye values can also be seen in the form of a line graph.
The appointment / clinic analytics page gives a breakdown of all the key metrics associated with historic appointments and all these metrics can be filtered through the ‘Optician’s Name’ as well.
I will give a detailed description of report development, once the submission deadline is over.
You can navigate the report on the following link.
Looking forward to feedback / suggestions / comments like always for continuous improvement and learning from other participants and the EDNA team.
Hope @sam.mckay likes EDNA being used as part of the company logo as well