Once again I look at these and fail to see how they help us to get any better.
I look at the submissions and figure why am I doing this I’m not a graphic artist or a design person.
It’s intimidating at best to us out there that don’t have any design/artistic abilities. What is wrong with a couple of charts and a couple of tables to get the point across.
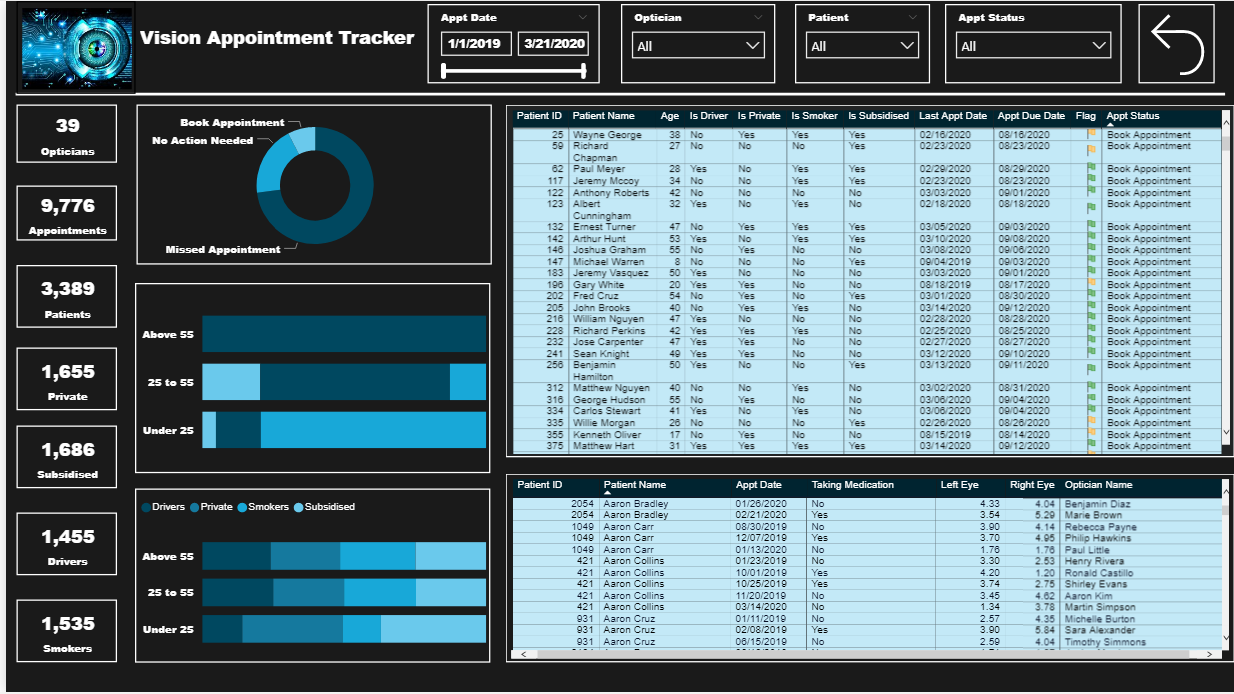
@GuyJohnson It is all about Data Story telling, if your end user can get the idea of what you are showing them in first 10 seconds of seeing the dashboard then your end goal is achieved. You don’t need to decorate a dashboard to make it look good, only few elements related to the data and boom you have a great report, for example someone above used glasses and without even looking at the data I know this report is somehow related to eyes.
Without debating the relative merits of the various design elements (or anything other than basic design elements at all), I would say if you don’t find the design aspect relevant for you and your work, just ignore it and focus on the incredible range of PQ, DAX and visualization techniques exhibited across the range of the submissions. These techniques are extremely versatile and can be applied across a wide range of problems, industries, etc.
I can say for certain that I’ve gotten significantly better in a number of areas by participating in these challenges and learning from the entries submitted and the subsequent write ups/discussions, and find it very hard to imagine that wouldn’t be true for everyone, although individually our takeaways will be different.
@GuyJohnson Don’t forget that its all about your audience, and what they expect. If the “report” will be client-facing or executive-facing, then they’re (often) used to high-quality presentations/graphics. One has more latitude when developing for internal audiences, but I’ve personally had many (consulting, granted) instances where a blocking “must” is something like:
> … if the layout and formatting are not consistent and ideal, how can I trust the data? …
So, for good or bad, the audience rules … whatever they need to have confidence in their analysis/decisions, and each organization/report series will have their own design criteria.
The truth is that time pressure always puts me back in my comfort zone. Although I can’t solve problems with DAX like a walk in the park I know where to look for resources that can help me to get to a solution within a certain time. On the other hand I can’t find so many resources on M code. Well there are resources, but the amount of DAX resources seems much larger to me. Maybe I have to improve the way I search… I don’t know for sure.
I will certainly look at @melissa’s Enterprise DNA TV YouTube Videos. Thanks!
You’re spot on about the gap between the quality and quantity of M versus DAX resources (at least until we can finally convince @Melissa to write “The Definitive Guide to M”…). in the interim, we have put together the following resource list, which is the best of what we found out there, but encourage everyone to add to this list as you find other good resources:
In addition, you may find this video helpful in terms of M practice strategies and tools:
WOW! I actually went back and compared the two entries side by side since my first impression was that this was a totally different entry. Amazing the difference the color theme change made. Really like the look of the revised version.
Would have to say, not my best work, but after being forced back into lock down in the last couple of days due to COVID in NZ, my creativity juices aren’t as alive at the moment.
I’ve kept it pretty simple this time round, but covered the brief.
It’s amazing how long this took me, when I look back and nothing I’ve done is that difficult. I guess it comes down to how creative you are feeling and if you can get into the ‘analytical zone’.
So impressed by other submissions to the challenge.
I’ll do my best to promote these in coming weeks. Just such good stuff, the whole world needs to see them!
The color theme looks very good and like the revised version. Itching to get started on the challenge but haven’t been able to due to work overload. Will submit my work over the weekend.
Fingers crossed!
I am struggling here with DAX calculations. Started looking into the challenge and I am missing a point which is messing up my calculations. I am trying to calculate the number of appointments missed. First I created a measure as
IF([Days since Last Appt] >[Appt Freq Days],“Missed”,“Not Missed”)
but then unable to count the number of appointments missed as Count function doesn’t work with measures but tables.
I know it’s a simple calculation but I am missing a point here big time.
@sunip Thanks for the reply. What I was missing was virtual tables in my calculation. With virtual tables, I can count or sum easily. Saw @sam.mckay videos on the channel and figured it out and now working on my report.