I figured out how to embed it! Too many words, let me use it
I saw this challenge just a few hours before it closed, so I figured I’d make a speed run at it.
- I skimmed the instructions and downloaded the data. I then loaded it into Power BI Desktop.
- In Transform Data / Power Query / M Script land, I decided to do these:
a. Corrected some date types
#“Changed Type” = Table.TransformColumnTypes(Opticaldta_Table,{{“Appt Date”, type datetime}, {"Patient Name ", type text}, {“DOB”, type date}, {“Age”, Int64.Type}, {“IsPrivate”, Int64.Type}, {“IsSubsidised”, Int64.Type}, {“IsSmoker”, Int64.Type}, {“IsDriver”, Int64.Type}, {“TakingMedication”, type text}, {“Left Eye Value”, type number}, {“Right Eye Value”, type number}, {“Optician First Name”, type text}, {“Optician Last Name”, type text}}),
b. Split the [Appt Date] to a [Appt Date Only] column and [Appt Time Only] column. This was so I could connect a Date table, and also show the appointments by hour of the day.
#“Duplicated Column” = Table.DuplicateColumn(#“Changed Type”, “Appt Date”, “Appt Date - Copy”),
#“Renamed Columns” = Table.RenameColumns(#“Duplicated Column”,{{“Appt Date - Copy”, “Appt Date Only”}}),
#“Extracted Date” = Table.TransformColumns(#“Renamed Columns”,{{“Appt Date Only”, DateTime.Date, type date}}),
#“Duplicated Column1” = Table.DuplicateColumn(#“Extracted Date”, “Appt Date”, “Appt Date - Copy”),
#“Extracted Time” = Table.TransformColumns(#“Duplicated Column1”,{{“Appt Date - Copy”, DateTime.Time, type time}}),
#“Renamed Columns1” = Table.RenameColumns(#“Extracted Time”,{{“Appt Date - Copy”, “Appt Time Only”}}),
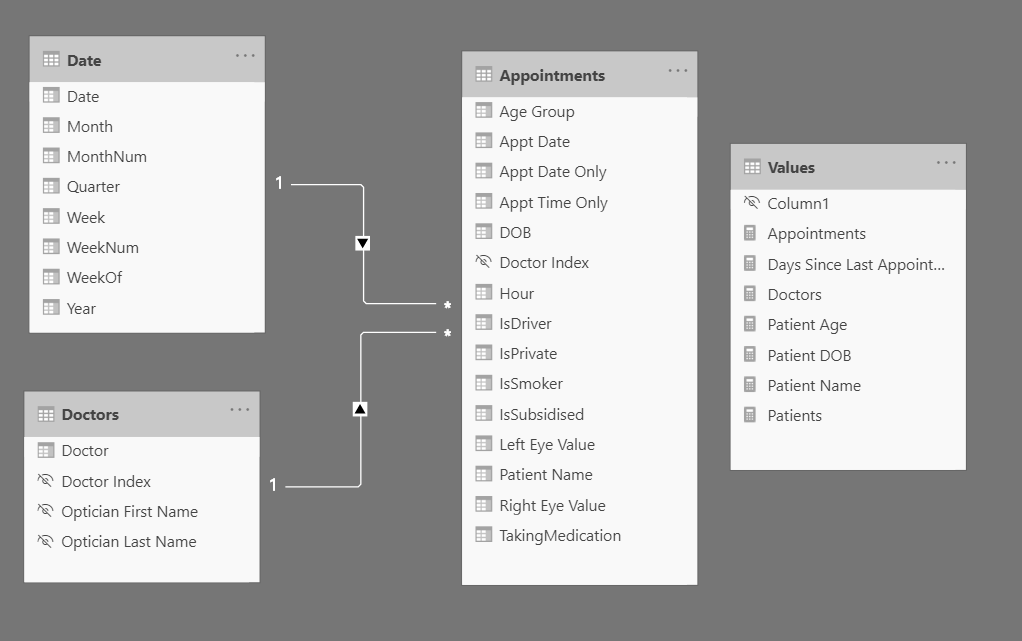
c. Decided to create a Doctor dimension. I duplicated my query, stripped out everything except the Optician’s first and last name, removed duplicates, created an index, then merged it back into the original query so it would have a link on the index to create the relationship.
d. I made the Excel workbook full path a parameter so I could share it as a template with someone else.
-
Ok Closed and Apply!
-
I created a measure table by going to Home → Enter Data, naming it “Values” and entered a 1 in Column1. After I create the first measure, I hide this column so I didn’t name it anything new. Sometimes I name it “Hide me” for fun.
-
I created measures! In the Values table:
Appointments = countrows(Appointments)
Days Since Last Appointment = datediff(today(),max(Appointments[Appt Date]),day)
Doctors = DISTINCTCOUNT(Doctors[Doctor Index])
Patient Age = datediff(max(Appointments[DOB]),today(),YEAR)
Patient DOB = if([Patients]=1,format(max(Appointments[DOB]),“dd mmm yyyy”),“Multiple Patients”)
Patient Name = if([Patients]=1,max(Appointments[Patient Name ]),“Multiple Patients”)
Patients = DISTINCTCOUNT(Appointments[Patient Name ])
- For the Doctors table I also added a calculated column. I could have done this in the Transform Data as well, but one of the benefits of a dimension table separate from the fact table is that I can make calculated columns that won’t kill performance. If I created it in the main fact table (the 10k appointments table) that would be terrible for performance. But the 36 row dimension table, that was ok. The idea is this would be a distinct way to show the Doctors. My assumption here is that no doctor had the same first and last name. If this was a real exercise, I would probably have included the Doctor ID in brackets behind the name to make sure it will be. For example, Dr. Zoe Douglas (4).
Doctor = "Dr. “&[Optician First Name]&” "&[Optician Last Name]
I went ahead and created the date table, created relationships between the tables, and hid all the columns needed for measures/relationships that I didn’t want to user to use in the reports.
-
Ok, so I had to quickly decide on what I wanted to do with the report. I decided on
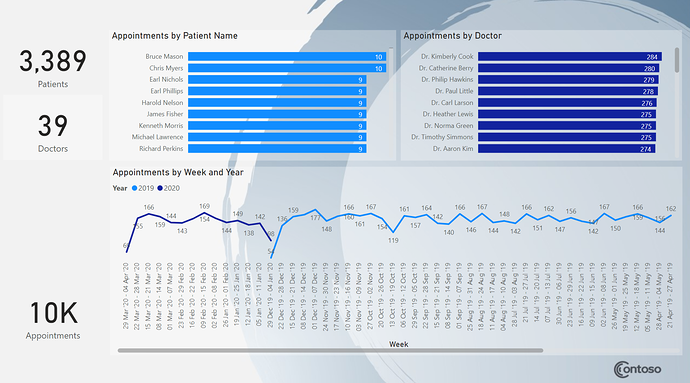
a. Summary page, that would kind of give an overall view of the data, nothing too specific
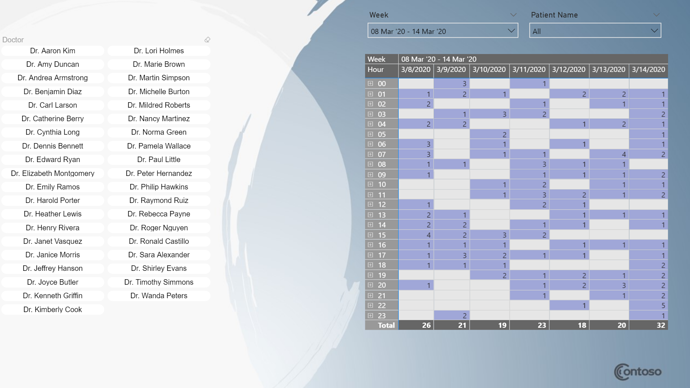
b. By Week page, this would show by a single week with days on the top and hours on the left what the appointment load looked like. Similar to the calendar in outlook.
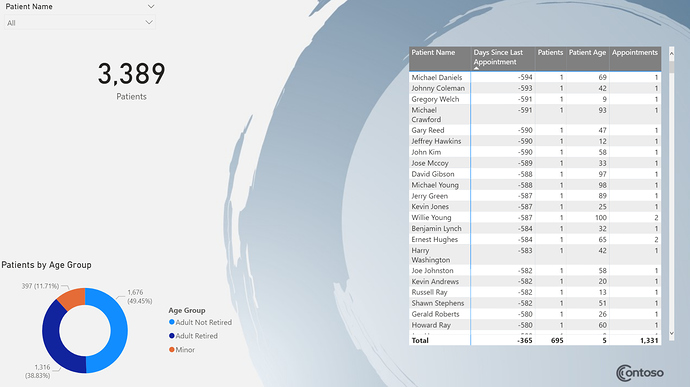
c. Overdue patients page, this would allow the user to quickly find patients that they need to contact to make appointments. Or check on a patient when they call in to see when their last appointment was, and if their insurance would cover a new appointment yet. I added the last part because I sometimes call my eye doctor to ask that.
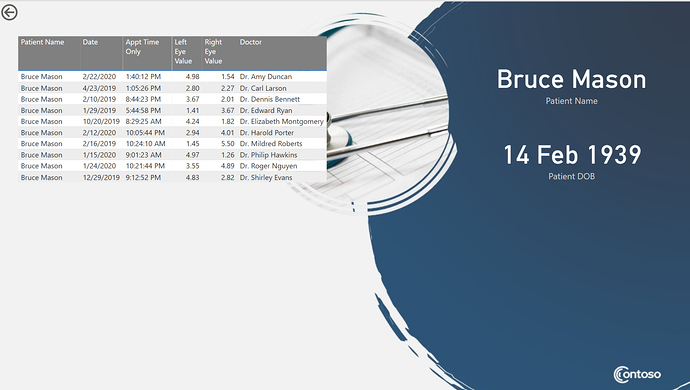
d. Appointment Details drill through page. In order to save space on the other pages, I allow the user to drill through on a count of appointments or a specific patient or doctor, or number of patients to see the full history of the appointments with the prescription values. I hid this page because I wanted them to access it via the drill through, not directly.
-
Now I started making charts and figuring out how I wanted them to be positioned. I immediately decided I wanted to make it pretty, so I went to PowerPoint to find some circular theme that I liked. I then saved the PPTX slides with backgrounds only as JPG and brought them in as page backgrounds in the report. I also chose to Image Fit = “Fit” to ensure it was a neat fit on the page. IF I had more time I would have customized the color palette and maybe looked into doing something with the Wallpaper and filter pane to make it look pretty too. Next challenge I want to use the pre-built themes on PowerBI Tips.
-
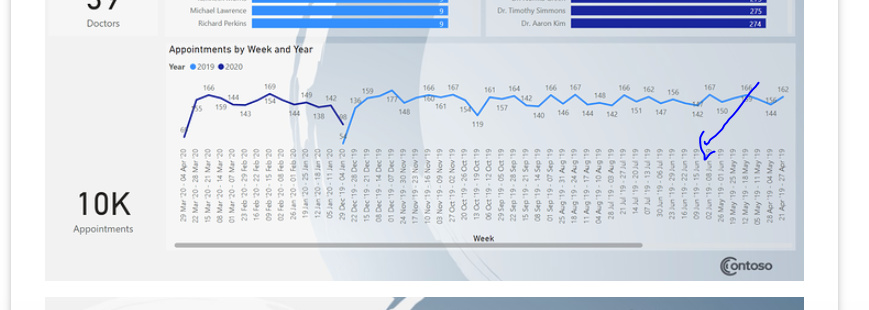
For the Summary page I chose 3 cards, a count of distinct patients, doctors and appointments. I then chose a chart for each of those. For patients and doctors I showed a bar chart to highlight who had the most appointments. For the appointments I decided to show this as a trend line – giving each year a different color and default aggregation by week. The idea was also to enable drill through to the “By Week” view but I forgot to actually set that up! This gives them an idea of weeks that may be heavier than others, which for a real eye doctor office would probably be school breaks or right before school started for their younger patients.
.
I do not like charts to be busy, so I remove axis titles and axis completely if there are data labels. I also prefer to be very descriptive with my week labels so that a person can determine what days exactly are included.
-
For the By Week page, the central idea was the matrix that would show one week at a time, days on the top, and hours on the left. I was surprised when I saw this was a 24 hour/7 days a week operation! And appointments were not started neatly on the hour. I grouped the times into hour of the day blocks to help me out.
.
For slicers, I added a slicer to choose the week in a drop down with search option. If I had more time, I’d have grouped the weeks into “Past”, “Future”, “Current” as well, to allow for the Current to always be default week, and added that in to the slicer making it a hierarchical slicer. I also added a patient name drop down with search, as there were lots of patients to choose from. For the doctors, as there were only 39, I did the large chiclet slicer with search. The chicklet was neat because I could also sort the order of the names by most to least appointments that week. After I thought about it, alphabetically probably would be been easier for the end user though.
.
You can right-click on the aggregated appointments in each day/hour block to go to the Appointments Details page.
-
I actually did the Overdue patients page last, and wanted to do more with it but ran out of time. Here really is a list of the patients ordered by days since last appointment, with some details, such as current age and total appointment they have had previously. The idea was that someone who had more appointments was most likely going to have their next appointment with us. I did an age group break down as well, as different age groups would most likely need a different schedule of appointments. You can search for a specific patient in the slicer drop down with search. And the card gives you an idea of how long that table on the right is.
.
You can drill through from the table to see details about the patients past appointments.
-
Appointment Details is the drill through page. I hid it because I didn’t want to start there, as that’s showing all 10k rows, and as this is just a demo, most likely it would be more than 10k rows unfiltered. This would be a performance hit having that big of a table without having it filtered first.
.
Because you could come at it from a single patient, multiple patients, a single doctor, multiple appointments or a single appointment, I included all those details in the table. If there is more than one patient it will say “Multiple patients” instead of the name and DOB of one of the individuals on the right. I also was going to include more details around smoking, etc, but didn’t quite get there.
See the report here: Use the report here!
Overall, I wish I had seen it earlier – even if I hadn’t spent more time on it, I would have liked more time to think about what I actually wanted to do with it, what analysis I would have wanted as a user of the report, even researching other reports similar to this. It was a fun exercise to see what I could get up in just a few hours, pushing me to decide quickly and not get sucked into nit-picking over colors or chart types.
Thanks and hope this write up is helpful!